
Siskiyou County, California
Siskiyou County, California | |
|---|---|
| County of Siskiyou | |
     Images, from top down, left to right: Mount Shasta, the historic West Miner Street in Yreka, Indian Tom Lake, Captain Jack's Stronghold in the Lava Beds National Monument, the McCloud River | |
 Flag  Seal | |
| Motto: "Mountains of Opportunity" | |
 Interactive map of Siskiyou County | |
 Location in the state of California | |
| Coordinates: 41°35′N 122°30′W / 41.583°N 122.500°W | |
| Country | United States |
| State | California |
| Region | Shasta Cascade |
| Incorporated | 1852 |
| Named for | The Siskiyou Trail |
| County seat | Yreka |
| Largest city | Yreka |
| Government | |
| • Type | Council–Administrator |
| • Chair | Ed Valenzuela |
| • Vice Chair | Michael N. Kobseff |
| • Board of Supervisors[1] | Supervisors
|
| • County Administrator | Terry Barber |
| Area | |
| • Total | 6,347 sq mi (16,440 km2) |
| • Land | 6,278 sq mi (16,260 km2) |
| • Water | 69 sq mi (180 km2) |
| Highest elevation FIPS code | 06-093 |
| GNIS feature ID | 277311 |
| Congressional district | 1st |
| Website | co |
Siskiyou County (
Siskiyou County is in the
History
This section needs additional citations for verification. (September 2013) |
Siskiyou County was created on March 22, 1852, from parts of Shasta and Klamath Counties, and named after the Siskiyou mountain range. Parts of the county's territory were given to Modoc County in 1855.
The county is the site of the central section of the
After the discovery of an important gold strike near today's Yreka, California, in 1851, prospectors flooded the area. This was described in detail by Joaquin Miller in his semi-autobiographical novel Life Amongst the Modocs.
In the mid-1880s, the construction of the
In the early 1940s, Siskiyou County was home to the semi-serious
The origin of the word Siskiyou is not known. It may be a
The county is home to the Black Bear Ranch, a commune started in 1968 with the slogan "Free Land for free people."
On September 4, 2013, the Siskiyou County Board of Supervisors voted 4 to 1 to secede from the State of California.[7]
Geography

According to the
Siskiyou County is geographically diverse. From towering
Flora and fauna
Substantial amounts of the county are forested within the Siskiyou and Cascade Ranges, including significant
Adjacent counties
- Josephine County, Oregon - northwest
- Jackson County, Oregon - north
- Klamath County, Oregon - northeast
- Modoc County - east
- Shasta County - southeast
- Trinity County - south
- Humboldt County - southwest
- Del Norte County - west
National protected areas

- Butte Valley National Grassland
- Klamath National Forest (part)
- Lava Beds National Monument (part)
- Lower Klamath National Wildlife Refuge (part)
- Modoc National Forest (part)
- Rogue River National Forest(part)
- Shasta National Forest(part)
- Six Rivers National Forest (part)
- Tule Lake National Wildlife Refuge (part)
- Tule Lake Unit, World War II Valor in the Pacific National Monument(part)
Transportation

Major highways
Public transportation
Siskiyou Transit And General Express (STAGE)[12] operates buses connecting the more populated areas of the county. Amtrak trains stop in Dunsmuir. Amtrak Thruway formerly operated between Sacramento and Medford, OR, with stops in Yreka, Weed, Mount Shasta, and Dunsmuir, for passengers connecting to and from Amtrak trains in Sacramento or Stockton; this service was discontinued in 2009. Greyhound buses pass through the county on Interstate 5 with a stop in Weed.
Airports
Siskiyou County owns and operates Butte Valley Airport, Happy Camp Airport, Scott Valley Airport, Siskiyou County Airport and Weed Airport (all general aviation). Dunsmuir Municipal-Mott Airport and Montague-Yreka Rohrer Field are also within the county.
The closest airports for commercial domestic plane departures are
Politics
Voter registration statistics
| Population and registered voters | ||
|---|---|---|
| Total population[13] | 44,687 | |
| Registered voters[14][note 1] | 25,582 | 57.2% |
| Democratic[14] | 8,253 | 32.3% |
| Republican[14] | 10,458 | 40.9% |
| Democratic–Republican spread[14] | -2,205 | -8.6% |
| Independent[14] | 1,126 | 4.4% |
| Green[14] | 196 | 0.8% |
| Libertarian[14] | 264 | 1.0% |
| Peace and Freedom[14] | 89 | 0.3% |
| Americans Elect[14] | 1 | 0.0% |
| Other[14] | 57 | 0.2% |
| No party preference[14] | 5,138 | 20.1% |
Cities by population and voter registration
| Cities by population and voter registration | |||||||
|---|---|---|---|---|---|---|---|
| City | Population[13] | Registered voters[14] [note 1] |
Democratic[14] | Republican[14] | D–R spread[14] | Other[14] | No party preference[14] |
| Dorris | 872 | 42.5% | 30.5% | 42.3% | -11.8% | 8.4% | 22.4% |
| Dunsmuir | 1,663 | 56.2% | 41.5% | 24.5% | +17.0% | 13.7% | 24.6% |
| Etna | 721 | 58.5% | 29.1% | 46.0% | -16.9% | 9.7% | 18.7% |
| Fort Jones | 595 | 63.5% | 30.4% | 44.4% | -14.0% | 10.1% | 18.8% |
| Montague | 1,510 | 47.8% | 24.8% | 44.6% | -19.8% | 12.3% | 23.8% |
| Mount Shasta | 3,411 | 59.8% | 42.6% | 25.3% | +17.3% | 10.4% | 25.3% |
| Tulelake | 981 | 24.9% | 22.5% | 54.5% | -32.0% | 8.6% | 18.4% |
| Weed | 2,947 | 44.8% | 45.6% | 24.0% | +21.6% | 14.5% | 21.7% |
| Yreka | 7,696 | 52.3% | 30.8% | 42.5% | -11.7% | 11.0% | 20.3% |
Overview
Siskiyou is a strongly Republican county in
| Year | Republican | Democratic | Third party | |||
|---|---|---|---|---|---|---|
| No. | % | No. | % | No. | % | |
| 2020 | 13,290 | 56.62% | 9,593 | 40.87% | 589 | 2.51% |
| 2016 | 11,341 | 55.34% | 7,234 | 35.30% | 1,918 | 9.36% |
| 2012 | 11,077 | 55.40% | 8,046 | 40.24% | 870 | 4.35% |
| 2008 | 11,520 | 53.42% | 9,292 | 43.09% | 752 | 3.49% |
| 2004 | 12,673 | 60.64% | 7,880 | 37.71% | 346 | 1.66% |
| 2000 | 12,198 | 61.55% | 6,323 | 31.90% | 1,298 | 6.55% |
| 1996 | 8,653 | 47.30% | 7,022 | 38.39% | 2,618 | 14.31% |
| 1992 | 6,660 | 32.21% | 8,254 | 39.91% | 5,765 | 27.88% |
| 1988 | 9,056 | 50.88% | 8,365 | 47.00% | 376 | 2.11% |
| 1984 | 10,544 | 58.25% | 7,130 | 39.39% | 427 | 2.36% |
| 1980 | 9,331 | 55.75% | 5,664 | 33.84% | 1,743 | 10.41% |
| 1976 | 7,070 | 48.37% | 7,060 | 48.31% | 485 | 3.32% |
| 1972 | 7,563 | 51.46% | 6,434 | 43.78% | 699 | 4.76% |
| 1968 | 6,334 | 46.13% | 6,260 | 45.59% | 1,138 | 8.29% |
| 1964 | 5,186 | 36.18% | 9,126 | 63.66% | 23 | 0.16% |
| 1960 | 6,279 | 42.95% | 8,245 | 56.40% | 96 | 0.66% |
| 1956 | 6,841 | 49.79% | 6,837 | 49.76% | 63 | 0.46% |
| 1952 | 8,735 | 55.69% | 6,800 | 43.35% | 151 | 0.96% |
| 1948 | 5,315 | 42.53% | 6,749 | 54.00% | 434 | 3.47% |
| 1944 | 4,351 | 42.15% | 5,914 | 57.29% | 58 | 0.56% |
| 1940 | 4,387 | 35.92% | 7,714 | 63.17% | 111 | 0.91% |
| 1936 | 2,919 | 29.46% | 6,865 | 69.28% | 125 | 1.26% |
| 1932 | 2,458 | 26.76% | 6,367 | 69.33% | 359 | 3.91% |
| 1928 | 3,758 | 55.49% | 2,916 | 43.06% | 98 | 1.45% |
| 1924 | 2,437 | 40.58% | 584 | 9.73% | 2,984 | 49.69% |
| 1920 | 2,909 | 60.05% | 1,502 | 31.01% | 433 | 8.94% |
| 1916 | 2,059 | 34.13% | 3,447 | 57.15% | 526 | 8.72% |
| 1912 | 29 | 0.58% | 2,465 | 49.57% | 2,479 | 49.85% |
| 1908 | 1,813 | 47.40% | 1,657 | 43.32% | 355 | 9.28% |
| 1904 | 2,104 | 59.67% | 1,219 | 34.57% | 203 | 5.76% |
| 1900 | 1,898 | 52.36% | 1,668 | 46.01% | 59 | 1.63% |
| 1896 | 1,473 | 44.98% | 1,724 | 52.64% | 78 | 2.38% |
| 1892 | 1,493 | 46.27% | 1,605 | 49.74% | 129 | 4.00% |
Siskiyou County is in California's 1st congressional district, represented by Republican Doug LaMalfa.[16]
In the
On November 4, 2008, Siskiyou County voted 60.1% for Proposition 8 which amended the California Constitution to ban same-sex marriages. Dunsmuir and Mount Shasta voted against Prop 8. [citation needed]
On September 3, 2013, the Siskiyou County Board of Supervisors voted 4–1 in favor of secession from California to form a proposed state named Jefferson.[19][20] A similar move was made in 1941, but was shelved due to the attack on Pearl Harbor.[21]
Crime
The following table includes the number of incidents reported and the rate per 1,000 persons for each type of offense.
| Population and crime rates | ||
|---|---|---|
| Population[13] | 44,687 | |
| Violent crime[22] | 183 | 4.10 |
| Homicide[22] | 1 | 0.02 |
| Forcible rape[22] | 18 | 0.40 |
| Robbery[22] | 16 | 0.36 |
| Aggravated assault[22] | 148 | 3.31 |
| Property crime[22] | 447 | 10.00 |
| Burglary[22] | 257 | 5.75 |
| Larceny-theft[22][note 2] | 467 | 10.45 |
| Motor vehicle theft[22] | 82 | 1.83 |
| Arson[22] | 3 | 0.07 |
Cities by population and crime rates
| Cities by population and crime rates | ||||||||
|---|---|---|---|---|---|---|---|---|
| City | Population[23] | Violent crimes[23] | Violent crime rate per 1,000 persons |
Property crimes[23] | Property crime rate per 1,000 persons | |||
| Dorris | 939 | 1 | 1.06 | 23 | 24.49 | |||
| Dunsmuir | 1,650 | 5 | 3.03 | 41 | 24.85 | |||
| Etna | 737 | 1 | 1.36 | 2 | 2.71 | |||
| Fort Jones | 841 | 0 | 0.00 | 14 | 16.65 | |||
| Lake Shastina | 2,460 | 0 | 0.00 | 0 | 0.00 | |||
| Montague | 1,443 | 2 | 1.39 | 6 | 4.16 | |||
| Mount Shasta | 3,396 | 5 | 1.47 | 79 | 23.26 | |||
| Tulelake | 1,010 | 1 | 0.99 | 5 | 4.95 | |||
| Weed | 2,970 | 18 | 6.06 | 125 | 42.09 | |||
| Yreka | 7,768 | 42 | 5.41 | 293 | 37.72 | |||
Demographics
2011
| Population, race, and income | |||||
|---|---|---|---|---|---|
| Total population[13] | 44,687 | ||||
| White[13] | 38,919 | 87.1% | |||
| Black or African American[13] | 519 | 1.2% | |||
| Native American or Alaska Native[13] | 1,287 | 2.9% | |||
| Asian[13] | 588 | 1.3% | |||
| Native Hawaiian or other Pacific Islander[13] | 142 | 0.3% | |||
| Some other race[13] | 516 | 1.2% | |||
| Two or more races[13] | 2,716 | 6.1% | |||
| Hispanic or Latino (of any race)[24] | 4,544 | 10.2% | |||
| Per capita income[25] | $22,335 | ||||
| Median household income[26] | $37,865 | ||||
| Median family income[27] | $47,632 | ||||
Places by population, race, and income
| Places by population and race | ||||||||
|---|---|---|---|---|---|---|---|---|
| Place | Type[28] | Population[13] | White[13] | Other[13] [note 3] |
Asian[13] | Black or African American[13] |
Native American[13] [note 4] |
Hispanic or Latino (of any race)[24] |
| Carrick | CDP | 123 | 100.0% | 0.0% | 0.0% | 0.0% | 0.0% | 0.0% |
| Dorris | City |
872 | 83.9% | 11.6% | 1.0% | 0.0% | 3.4% | 25.1% |
| Dunsmuir | City |
1,663 | 85.9% | 8.5% | 1.5% | 1.6% | 2.4% | 7.5% |
| Edgewood | CDP | 49 | 85.7% | 14.3% | 0.0% | 0.0% | 0.0% | 14.3% |
| Etna | City |
721 | 86.8% | 10.1% | 0.6% | 0.0% | 2.5% | 9.3% |
| Fort Jones | City |
595 | 91.8% | 3.2% | 0.2% | 2.4% | 2.5% | 6.6% |
| Gazelle | CDP | 153 | 71.2% | 24.8% | 0.0% | 0.0% | 3.9% | 22.2% |
| Greenview | CDP | 376 | 89.4% | 10.6% | 0.0% | 0.0% | 0.0% | 0.0% |
| Grenada | CDP | 322 | 81.4% | 8.7% | 0.0% | 0.0% | 9.9% | 2.8% |
| Happy Camp | CDP | 1,170 | 61.3% | 12.2% | 6.9% | 0.8% | 18.8% | 4.6% |
| Hornbrook | CDP | 334 | 89.8% | 1.5% | 2.4% | 0.0% | 6.3% | 5.7% |
| McCloud | CDP | 1,288 | 94.5% | 1.6% | 2.2% | 0.8% | 1.0% | 5.1% |
| Macdoel | CDP | 108 | 38.0% | 62.0% | 0.0% | 0.0% | 0.0% | 72.2% |
| Montague | City |
1,510 | 80.7% | 12.5% | 0.6% | 0.2% | 6.0% | 16.9% |
| Mount Hebron | CDP | 72 | 94.4% | 0.0% | 0.0% | 0.0% | 5.6% | 31.9% |
| Mount Shasta | City |
3,411 | 93.3% | 6.5% | 0.0% | 0.2% | 0.0% | 8.6% |
| Tennant | CDP | 55 | 65.5% | 5.5% | 29.1% | 0.0% | 0.0% | 0.0% |
| Tulelake | City |
981 | 83.1% | 8.1% | 1.0% | 5.2% | 2.7% | 55.2% |
| Weed | City |
2,947 | 87.8% | 5.0% | 1.1% | 3.7% | 2.5% | 15.8% |
| Yreka | City |
7,696 | 84.6% | 8.9% | 1.9% | 1.3% | 3.4% | 10.3% |
| Places by population and income | |||||
|---|---|---|---|---|---|
| Place | Type[28] | Population[29] | Per capita income[25] | Median household income[26] | Median family income[27] |
| Carrick | CDP | 123 | $13,418 | $12,269 | $37,386 |
| Dorris | City |
872 | $15,058 | $32,500 | $37,880 |
| Dunsmuir | City |
1,663 | $21,465 | $36,813 | $47,958 |
| Edgewood | CDP | 49 | $26,247 | $44,063 | $43,438 |
| Etna | City |
721 | $16,854 | $30,455 | $31,875 |
| Fort Jones | City |
595 | $15,363 | $26,875 | $38,947 |
| Gazelle | CDP | 153 | $13,808 | $19,333 | $27,344 |
| Greenview | CDP | 376 | $19,574 | $45,640 | $45,640 |
| Grenada | CDP | 322 | $21,354 | $27,955 | $40,417 |
| Happy Camp | CDP | 1,170 | $13,909 | $23,438 | $30,500 |
| Hornbrook | CDP | 334 | $13,494 | $27,143 | $36,528 |
| McCloud | CDP | 1,288 | $19,543 | $31,630 | $49,922 |
| Macdoel | CDP | 108 | $17,961 | $51,534 | $53,750 |
| Montague | City |
1,510 | $15,971 | $33,438 | $44,875 |
| Mount Hebron | CDP | 72 | $18,090 | $25,875 | $24,464 |
| Mount Shasta | City |
3,411 | $24,705 | $39,575 | $62,500 |
| Tennant | CDP | 55 | $13,035 | $18,365 | $18,250 |
| Tulelake | City |
981 | $13,174 | $26,389 | $36,500 |
| Weed | City |
2,947 | $15,124 | $25,659 | $37,917 |
| Yreka | City |
7,696 | $21,169 | $31,151 | $41,750 |
2010
| Census | Pop. | Note | %± |
|---|---|---|---|
| 1860 | 7,629 | — | |
| 1870 | 6,848 | −10.2% | |
| 1880 | 8,610 | 25.7% | |
| 1890 | 12,163 | 41.3% | |
| 1900 | 16,962 | 39.5% | |
| 1910 | 18,801 | 10.8% | |
| 1920 | 18,545 | −1.4% | |
| 1930 | 25,480 | 37.4% | |
| 1940 | 28,598 | 12.2% | |
| 1950 | 30,733 | 7.5% | |
| 1960 | 32,885 | 7.0% | |
| 1970 | 33,225 | 1.0% | |
| 1980 | 39,732 | 19.6% | |
| 1990 | 43,531 | 9.6% | |
| 2000 | 44,301 | 1.8% | |
| 2010 | 44,900 | 1.4% | |
| 2020 | 44,076 | −1.8% | |
| 2023 (est.) | 42,905 | [30] | −2.7% |
| U.S. Decennial Census[31] 1790-1960[32] 1900-1990[33] 1990-2000[34] 2010-2015[3] | |||
The
| Population reported at 2010 United States Census
| |||||||||
|---|---|---|---|---|---|---|---|---|---|
The County |
Total Population |
White |
African American |
Native American |
Asian |
Pacific Islander |
other races |
two or more races |
Latino (of any race) |
| Siskiyou County | 44,900 | 38,030 | 571 | 1,814 | 540 | 80 | 1,491 | 2,374 | 4,615 |
Incorporated cities and towns |
Total Population |
White |
African American |
Native American |
Asian |
Pacific Islander |
other races |
two or more races |
Latino (of any race) |
| Dorris | 939 | 764 | 19 | 18 | 5 | 8 | 77 | 48 | 197 |
| Dunsmuir | 1,650 | 1,443 | 32 | 17 | 15 | 4 | 30 | 109 | 167 |
| Etna | 737 | 627 | 0 | 28 | 1 | 1 | 6 | 74 | 26 |
| Fort Jones | 839 | 650 | 33 | 61 | 8 | 0 | 23 | 64 | 103 |
| Montague | 1,443 | 1,251 | 4 | 67 | 8 | 1 | 17 | 95 | 107 |
| Mount Shasta | 3,394 | 3,041 | 61 | 19 | 56 | 2 | 51 | 164 | 277 |
| Tulelake | 1,010 | 563 | 1 | 15 | 1 | 0 | 365 | 65 | 601 |
| Weed | 2,967 | 2,221 | 206 | 70 | 121 | 27 | 132 | 190 | 475 |
| Yreka | 7,765 | 6,495 | 57 | 491 | 94 | 9 | 168 | 451 | 753 |
Total Population |
White |
African American |
Native American |
Asian |
Pacific Islander |
other races |
two or more races |
Latino (of any race) | |
| Carrick | 131 | 110 | 7 | 2 | 2 | 0 | 1 | 9 | 8 |
| Edgewood | 43 | 41 | 0 | 0 | 0 | 0 | 1 | 1 | 2 |
| Gazelle | 70 | 65 | 0 | 4 | 0 | 0 | 1 | 0 | 5 |
| Greenview | 201 | 161 | 0 | 10 | 1 | 0 | 8 | 21 | 19 |
| Grenada | 367 | 307 | 2 | 35 | 1 | 0 | 3 | 19 | 12 |
| Happy Camp | 1,190 | 814 | 2 | 277 | 7 | 1 | 18 | 71 | 95 |
| Hornbrook | 248 | 195 | 0 | 15 | 0 | 0 | 10 | 28 | 19 |
| Macdoel | 133 | 57 | 0 | 6 | 0 | 0 | 69 | 1 | 78 |
| McCloud | 1,101 | 1,039 | 8 | 10 | 6 | 0 | 5 | 33 | 65 |
| Mount Hebron | 95 | 73 | 0 | 1 | 0 | 0 | 18 | 3 | 41 |
| Tennant | 41 | 36 | 0 | 2 | 0 | 0 | 1 | 2 | 4 |
Other unincorporated areas |
Total Population |
White |
African American |
Native American |
Asian |
Pacific Islander |
other races |
two or more races |
Latino (of any race) |
| All others not CDPs (combined) | 20,536 | 18,077 | 139 | 666 | 214 | 27 | 487 | 926 | 1,561 |
2000
As of the
There were 18,556 households, out of which 27.6% had children under the age of 18 living with them, 51.7% were married couples living together, 10.1% had a female householder with no husband present, and 34.1% were non-families. 28.6% of all households were made up of individuals, and 12.8% had someone living alone who was 65 years of age or older. The average household size was 2.35 and the average family size was 2.87.
In the county, the population was spread out, with 24.0% under the age of 18, 6.7% from 18 to 24, 22.7% from 25 to 44, 28.4% from 45 to 64, and 18.1% who were 65 years of age or older. The median age was 43 years. For every 100 females there were 96.5 males. For every 100 females age 18 and over, there were 94.1 males.
The median income for a household in the county was $29,530, and the median income for a family was $36,890. Males had a median income of $31,936 versus $22,650 for females. The
Communities

Cities
- Dorris
- Dunsmuir
- Etna
- Fort Jones
- Montague
- Mount Shasta
- Tulelake
- Weed
- Yreka (county seat)
Census-designated places
Other unincorporated communities
- Ager
- Bestville
- Black Bear
- Black Butte
- Callahan
- Cecilville
- Forks of Salmon
- Hamburg
- Hatfield(partial)
- Hilt
- Horse Creek
- Klamath River
- Little Shasta
- Oro Fino
- Pondosa
- Sawyers Bar
- Scott Bar
- Seiad Valley
- Somes Bar
Ghost towns
Population ranking
The population ranking of the following table is based on the 2020 census of Siskiyou County.
† county seat
| Rank | City/Town/etc. | Municipal type | Population (2020 Census) |
|---|---|---|---|
| 1 | † Yreka | City | 7,807 |
| 2 | Mount Shasta | City | 3,223 |
| 3 | Weed | City | 2,862 |
| 4 | Lake Shastina | CDP | 2,401 |
| 5 | Dunsmuir | City | 1,707 |
| 6 | Montague | City | 1,226 |
| 7 | McCloud | CDP | 945 |
| 8 | Happy Camp | CDP | 905 |
| 9 | Tulelake | City | 902 |
| 10 | Dorris | City | 860 |
| 11 | Fort Jones | City | 695 |
| 12 | Etna | City | 678 |
| 13 | Karuk Reservation[38] | AIAN | 578 |
| 14 | Grenada | CDP | 314 |
| 15 | Hornbrook | CDP | 266 |
| 16 | Greenview | CDP | 208 |
| 17 | Quartz Valley Reservation[39] | AIAN | 202 |
| 18 | Carrick | CDP | 143 |
| 19 | Mount Hebron | CDP | 103 |
| 20 | Gazelle | CDP | 95 |
| 21 | Macdoel | CDP | 86 |
| 22 | Edgewood | CDP | 72 |
| 23 | Tennant | CDP | 63 |
See also
- List of school districts in Siskiyou County, California
- List of museums in the Shasta Cascade (California)
- National Register of Historic Places listings in Siskiyou County, California
- Upper Soda Springs
- Shasta Springs
- Yreka Western Railroad
Notes
- ^ a b Percentage of registered voters with respect to total population. Percentages of party members with respect to registered voters follow.
- ^ Only larceny-theft cases involving property over $400 in value are reported as property crimes.
- ^ Other = Some other race + Two or more races
- ^ Native American = Native Hawaiian or other Pacific Islander + American Indian or Alaska Native
References
- ^ "Board of Supervisors | Siskiyou County California". www.co.siskiyou.ca.us.
- ^ "Mount Shasta". Peakbagger.com. Retrieved February 2, 2015.
- ^ a b c "State & County QuickFacts". United States Census Bureau. Retrieved December 6, 2021.
- ^ "Find a County". National Association of Counties. Retrieved June 7, 2011.
- ^ "Boundaries". Cascadia Institute. Retrieved August 27, 2021.
- ISBN 9780520389670.
- ^ "Siskiyou County supervisors vote to pursue seceding from state", The Record Searchlight, redding.com, September 4, 2013
- ^ "US Gazetteer files: 2010, 2000, and 1990". United States Census Bureau. February 12, 2011. Retrieved April 23, 2011.
- ^ "Siskiyou Archives". FishingWorks. Archived from the original on October 29, 2013.
- ^ C. Michael Hogan (2008) Aesculus californica, Globaltwitcher.com, ed. N. Stromberg Archived November 22, 2012, at the Wayback Machine
- ^ Siskiyou County factsheet Archived October 11, 2006, at the Wayback Machine
- ^ "STAGE". Transit.wiki. Retrieved January 1, 2023.
- ^ a b c d e f g h i j k l m n o p q U.S. Census Bureau. American Community Survey, 2011 American Community Survey 5-Year Estimates, Table B02001. U.S. Census website. Retrieved October 26, 2013.
- ^ a b c d e f g h i j k l m n o p q California Secretary of State. February 10, 2013 - Report of Registration Archived July 27, 2013, at the Wayback Machine. Retrieved October 31, 2013.
- ^ Leip, David. "Dave Leip's Atlas of U.S. Presidential Elections". uselectionatlas.org.
- ^ "California's 1st Congressional District - Representatives & District Map". Civic Impulse, LLC. Retrieved February 28, 2013.
- ^ "Senators". State of California. Retrieved March 10, 2013.
- ^ "Members Assembly". State of California. Retrieved March 2, 2013.
- ^ Longoria, Sean, Siskiyou supervisors support withdrawal from California Archived June 20, 2014, at the Wayback Machine, Redding Record Searchlight, September 4, 2013, accessed September 4, 2013
- ^ Mather, Kate, Siskiyou County votes to pursue secession from California, Los Angeles Times, September 4, 2013, accessed September 4, 2013
- ^ Northern California County Board Votes For Secession From State, CBS, San Francisco, September 4, 2013
- ^ a b c d e f g h i j Office of the Attorney General, Department of Justice, State of California. Table 11: Crimes – 2009. Retrieved November 14, 2013. Archived December 2, 2013, at the Wayback Machine
- ^ a b c United States Department of Justice, Federal Bureau of Investigation. Crime in the United States, 2012, Table 8 (California). Retrieved November 14, 2013.
- ^ a b U.S. Census Bureau. American Community Survey, 2011 American Community Survey 5-Year Estimates, Table B03003. U.S. Census website. Retrieved October 26, 2013.
- ^ a b U.S. Census Bureau. American Community Survey, 2011 American Community Survey 5-Year Estimates, Table B19301. U.S. Census website. Retrieved October 21, 2013.
- ^ a b U.S. Census Bureau. American Community Survey, 2011 American Community Survey 5-Year Estimates, Table B19013. U.S. Census website. Retrieved October 21, 2013.
- ^ a b U.S. Census Bureau. American Community Survey, 2011 American Community Survey 5-Year Estimates, Table B19113. U.S. Census website. Retrieved October 21, 2013.
- ^ a b U.S. Census Bureau. American Community Survey, 2011 American Community Survey 5-Year Estimates. U.S. Census website. Retrieved October 21, 2013.
- ^ U.S. Census Bureau. American Community Survey, 2011 American Community Survey 5-Year Estimates, Table B01003. U.S. Census website. Retrieved October 21, 2013.
- ^ "Annual Estimates of the Resident Population for Counties: April 1, 2020 to July 1, 2023". United States Census Bureau. Retrieved March 26, 2024.
- ^ "U.S. Decennial Census". United States Census Bureau. Retrieved May 31, 2014.
- ^ "Historical Census Browser". University of Virginia Library. Retrieved May 31, 2014.
- ^ "Population of Counties by Decennial Census: 1900 to 1990". United States Census Bureau. Retrieved May 31, 2014.
- ^ "Census 2000 PHC-T-4. Ranking Tables for Counties: 1990 and 2000" (PDF). United States Census Bureau. Retrieved May 31, 2014.
- ^ "2010 Census P.L. 94-171 Summary File Data". United States Census Bureau.
- ^ "U.S. Census website". United States Census Bureau. Retrieved May 14, 2011.
- ^ "Siskiyou County, CA - Siskiyou County, California - Ancestry & family history - ePodunk". www.epodunk.com. Archived from the original on April 22, 2014. Retrieved March 30, 2012.
- ^ Staff, Website Services & Coordination. "U.S. Census Bureau 2020 Census". www.census.gov.
- ^ Staff, Website Services & Coordination. "U.S. Census Bureau 2020 Census". www.census.gov.
Further reading
- Harry L. Wells, History of Siskiyou County, California: Illustrated with Views of Residences, Business Buildings and Natural Scenery and Containing Portraits and Biographies of Its Leading Citizens and Pioneers. Oakland, CA: D.J. Stewart and Co., 1881.
External links
Places adjacent to Siskiyou County, California | ||||||||||||||||
|---|---|---|---|---|---|---|---|---|---|---|---|---|---|---|---|---|
| ||||||||||||||||
Municipalities and communities of Siskiyou County, California, United States | ||
|---|---|---|
| Cities | 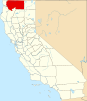 | |
| CDPs | ||
| Unincorporated communities | ||
| Indian reservation | ||
| Ghost towns | ||
| Footnotes | ‡This populated place also has portions in an adjacent county or counties | |
| ||
| International | |
|---|---|
| National | |
| Geographic | |
| Other | |