
Smith County, Kansas
Smith County | |
|---|---|
UTC−5 (CDT) | |
| Area code | 785 |
| Congressional district | 1st |
| Website | SmithCoKS.com |
Smith County is a
History
Early history
For many
19th century
In 1802, Spain returned most of the land to France, but keeping title to about 7,500 square miles.[citation needed] In 1803, most of the land for modern day Kansas was acquired by the United States from France as part of the 828,000 square mile Louisiana Purchase for 2.83 cents per acre.
In 1854, the Kansas Territory was organized, then in 1861 Kansas became the 34th U.S. state. In 1872, Smith County was established. The first homestead in Smith County was in 1871 and there were 3,800 inhabitants by 1875. The county grew to 15,000 people by 1889. Corn was the main crop at first but drought and grasshopper plagues severely hurt the crops. When hardy Winter wheat was introduced to Kansas by Russian settlers, it eventually became the predominant crop in Smith County. The population of the county has slowly declined since 1900 due in large part because of advanced farming techniques that require less human labor.[citation needed]
Brewster Higley wrote the song "
Geography
According to the
The geographic center of the 48 contiguous states is located within the county, near the city of Lebanon.[7] The geographic center of North America is located in neighboring Osborne County.
The Solomon River runs through the southern part of the county and provides a flat basin and water for irrigated crops.
Major highways
There are two major
Adjacent counties
- Webster County, Nebraska (northeast)
- Jewell County (east)
- Osborne County (south)
- Rooks County (southwest)
- Phillips County (west)
- Franklin County, Nebraska (northwest)
Demographics

| Census | Pop. | Note | %± |
|---|---|---|---|
| 1870 | 66 | — | |
| 1880 | 13,883 | 20,934.8% | |
| 1890 | 15,613 | 12.5% | |
| 1900 | 16,384 | 4.9% | |
| 1910 | 15,365 | −6.2% | |
| 1920 | 14,985 | −2.5% | |
| 1930 | 13,545 | −9.6% | |
| 1940 | 10,582 | −21.9% | |
| 1950 | 8,846 | −16.4% | |
| 1960 | 7,776 | −12.1% | |
| 1970 | 6,757 | −13.1% | |
| 1980 | 5,947 | −12.0% | |
| 1990 | 5,078 | −14.6% | |
| 2000 | 4,536 | −10.7% | |
| 2010 | 3,853 | −15.1% | |
| 2020 | 3,570 | −7.3% | |
| 2023 (est.) | 3,590 | [8] | 0.6% |
| U.S. Decennial Census[9] 1790-1960[10] 1900-1990[11] 1990-2000[12] 2010-2020[1] | |||
As of the
There were 1,953 households, out of which 25.60% had children under the age of 18 living with them, 60.60% were married couples living together, 4.70% had a female householder with no husband present, and 32.30% were non-families. 30.20% of all households were made up of individuals, and 18.60% had someone living alone who was 65 years of age or older. The average household size was 2.27 and the average family size was 2.78.
In the county, the population was spread out, with 21.70% under the age of 18, 4.70% from 18 to 24, 22.10% from 25 to 44, 23.60% from 45 to 64, and 27.90% who were 65 years of age or older. The median age was 46 years. For every 100 females there were 92.70 males. For every 100 females age 18 and over, there were 90.40 males.
The median income for a household in the county was $28,486, and the median income for a family was $36,951. Males had a median income of $25,089 versus $18,608 for females. The
The population distribution by township is as follows according to the 2000 census: Banner 54; Beaver 60; Blaine 60; Cedar 619; Center 2,094; Cora 38; Crystal Plains 40; Dor 46; Garfield 33; German 34; Harlan 100; Harvey 130; Houston 206; Lane 134; Lincoln 73; Logan 47; Martin 24; Oak 399; Pawnee 35; Pleasant 34; Swan 42; Valley 75; Washington 63; Webster 47; White Rock 49.
Government
Presidential elections
| Year | Republican | Democratic | Third party | |||
|---|---|---|---|---|---|---|
| No. | % | No. | % | No. | % | |
| 2020 | 1,763 | 82.81% | 336 | 15.78% | 30 | 1.41% |
| 2016 | 1,661 | 81.34% | 297 | 14.54% | 84 | 4.11% |
| 2012 | 1,624 | 80.28% | 358 | 17.70% | 41 | 2.03% |
| 2008 | 1,719 | 77.78% | 446 | 20.18% | 45 | 2.04% |
| 2004 | 1,803 | 76.08% | 540 | 22.78% | 27 | 1.14% |
| 2000 | 1,534 | 70.24% | 534 | 24.45% | 116 | 5.31% |
| 1996 | 1,628 | 65.38% | 638 | 25.62% | 224 | 9.00% |
| 1992 | 1,236 | 43.34% | 789 | 27.66% | 827 | 29.00% |
| 1988 | 1,951 | 65.29% | 1,004 | 33.60% | 33 | 1.10% |
| 1984 | 2,332 | 75.74% | 684 | 22.22% | 63 | 2.05% |
| 1980 | 2,415 | 71.70% | 719 | 21.35% | 234 | 6.95% |
| 1976 | 2,009 | 58.47% | 1,333 | 38.80% | 94 | 2.74% |
| 1972 | 2,600 | 74.26% | 818 | 23.36% | 83 | 2.37% |
| 1968 | 2,558 | 67.49% | 939 | 24.78% | 293 | 7.73% |
| 1964 | 2,026 | 52.34% | 1,809 | 46.73% | 36 | 0.93% |
| 1960 | 3,013 | 71.88% | 1,157 | 27.60% | 22 | 0.52% |
| 1956 | 3,142 | 72.95% | 1,139 | 26.45% | 26 | 0.60% |
| 1952 | 3,623 | 77.75% | 986 | 21.16% | 51 | 1.09% |
| 1948 | 2,760 | 61.94% | 1,590 | 35.68% | 106 | 2.38% |
| 1944 | 3,282 | 69.93% | 1,377 | 29.34% | 34 | 0.72% |
| 1940 | 3,630 | 65.58% | 1,855 | 33.51% | 50 | 0.90% |
| 1936 | 3,292 | 53.48% | 2,847 | 46.25% | 17 | 0.28% |
| 1932 | 2,870 | 46.52% | 3,155 | 51.14% | 144 | 2.33% |
| 1928 | 4,021 | 74.34% | 1,338 | 24.74% | 50 | 0.92% |
| 1924 | 3,226 | 57.23% | 1,634 | 28.99% | 777 | 13.78% |
| 1920 | 3,251 | 66.10% | 1,535 | 31.21% | 132 | 2.68% |
| 1916 | 2,605 | 41.08% | 3,431 | 54.10% | 306 | 4.82% |
| 1912 | 970 | 25.84% | 1,534 | 40.86% | 1,250 | 33.30% |
| 1908 | 1,843 | 51.65% | 1,593 | 44.65% | 132 | 3.70% |
| 1904 | 2,254 | 66.02% | 596 | 17.46% | 564 | 16.52% |
| 1900 | 1,770 | 46.47% | 1,978 | 51.93% | 61 | 1.60% |
| 1896 | 1,385 | 40.23% | 2,019 | 58.64% | 39 | 1.13% |
| 1892 | 1,389 | 41.33% | 0 | 0.00% | 1,972 | 58.67% |
| 1888 | 1,726 | 51.71% | 777 | 23.28% | 835 | 25.01% |
Smith County is overwhelmingly Republican. No Democratic presidential candidate has won Smith County since
Laws
Following amendment to the
Education
Unified school districts
Communities

Cities
- Athol
- Cedar
- Gaylord
- Kensington
- Lebanon
- Smith Center (county seat)
Unincorporated communities
Ghost towns
Townships
Smith County is divided into twenty-five townships. None of the cities within the county are considered governmentally independent, and all figures for the townships include those of the cities. In the following table, the population center is the largest city (or cities) included in that township's population total, if it is of a significant size.
| Township | FIPS |
Population center |
Population | Population density /km2 (/sq mi) |
Land area km2 (sq mi) |
Water area km2 (sq mi) |
Water % | Geographic coordinates |
|---|---|---|---|---|---|---|---|---|
| Banner | 04100 | 54 | 0.58 (1.50) | 93.29 (36.02) | 0 (0) | 0% | 39°42′3″N 98°47′13″W / 39.70083°N 98.78694°W | |
| Beaver | 05200 | 60 | 0.65 (1.67) | 92.89 (35.86) | 0.27 (0.10) | 0.29% | 39°56′50″N 98°46′34″W / 39.94722°N 98.77611°W | |
| Blaine | 07200 | 60 | 0.64 (1.67) | 93.24 (36.00) | 0.04 (0.01) | 0.04% | 39°47′20″N 98°40′48″W / 39.78889°N 98.68000°W | |
| Cedar | 11350 | Kensington | 619 | 6.68 (17.29) | 92.71 (35.80) | 0.08 (0.03) | 0.09% | 39°46′10″N 99°1′50″W / 39.76944°N 99.03056°W |
| Center | 12175 | Smith Center | 2,094 | 22.48 (58.22) | 93.15 (35.97) | 0.04 (0.02) | 0.05% | 39°46′47″N 98°47′7″W / 39.77972°N 98.78528°W |
| Cora | 15525 | 38 | 0.41 (1.06) | 92.96 (35.89) | 0.17 (0.06) | 0.18% | 39°52′45″N 98°40′7″W / 39.87917°N 98.66861°W | |
| Crystal Plains | 16575 | 40 | 0.43 (1.11) | 93.00 (35.91) | 0.05 (0.02) | 0.05% | 39°41′27″N 98°40′52″W / 39.69083°N 98.68111°W | |
| Dor | 18300 | 46 | 0.50 (1.29) | 92.55 (35.73) | 0.30 (0.11) | 0.32% | 39°37′33″N 99°0′4″W / 39.62583°N 99.00111°W | |
| Garfield | 25825 | 33 | 0.35 (0.92) | 92.96 (35.89) | 0.04 (0.02) | 0.04% | 39°35′48″N 98°40′21″W / 39.59667°N 98.67250°W | |
| German | 26150 | 34 | 0.37 (0.96) | 91.78 (35.44) | 0.27 (0.10) | 0.29% | 39°56′41″N 99°0′39″W / 39.94472°N 99.01083°W | |
| Harlan | 30100 | 100 | 1.07 (2.78) | 93.03 (35.92) | 0.05 (0.02) | 0.05% | 39°36′25″N 98°46′42″W / 39.60694°N 98.77833°W | |
| Harvey | 30550 | Cedar | 130 | 1.40 (3.63) | 92.86 (35.85) | 0.00 (0.00) | 0% | 39°41′10″N 98°55′32″W / 39.68611°N 98.92556°W |
| Houston | 33225 | Gaylord | 206 | 2.22 (5.74) | 92.94 (35.88) | 0.14 (0.05) | 0.15% | 39°37′38″N 98°52′12″W / 39.62722°N 98.87000°W |
| Lane | 38450 | Athol | 134 | 1.44 (3.73) | 92.98 (35.90) | 0.03 (0.01) | 0.04% | 39°46′49″N 98°53′30″W / 39.78028°N 98.89167°W |
| Lincoln | 41200 | 73 | 0.79 (2.04) | 92.80 (35.83) | 0.15 (0.06) | 0.16% | 39°36′13″N 98°33′23″W / 39.60361°N 98.55639°W | |
| Logan | 42275 | 47 | 0.51 (1.32) | 92.50 (35.72) | 0.14 (0.05) | 0.15% | 39°57′5″N 98°34′4″W / 39.95139°N 98.56778°W | |
| Martin | 45000 | 24 | 0.26 (0.67) | 92.49 (35.71) | 0.25 (0.10) | 0.27% | 39°56′40″N 98°54′21″W / 39.94444°N 98.90583°W | |
| Oak | 51650 | Lebanon | 399 | 4.30 (11.13) | 92.88 (35.86) | 0.07 (0.03) | 0.07% | 39°48′10″N 98°33′29″W / 39.80278°N 98.55806°W |
| Pawnee | 54825 | 35 | 0.38 (0.98) | 92.13 (35.57) | 0.41 (0.16) | 0.44% | 39°57′7″N 98°39′50″W / 39.95194°N 98.66389°W | |
| Pleasant | 56300 | 34 | 0.37 (0.95) | 92.69 (35.79) | 0.05 (0.02) | 0.05% | 39°51′28″N 98°54′28″W / 39.85778°N 98.90778°W | |
| Swan | 69625 | 42 | 0.46 (1.18) | 92.00 (35.52) | 0.23 (0.09) | 0.25% | 39°52′56″N 99°1′12″W / 39.88222°N 99.02000°W | |
| Valley | 73175 | 75 | 0.81 (2.09) | 92.82 (35.84) | 0.015 (0.006) | 0.02% | 39°41′28″N 98°59′59″W / 39.69111°N 98.99972°W | |
| Washington | 75775 | 63 | 0.68 (1.76) | 92.87 (35.86) | 0 (0) | 0% | 39°52′54″N 98°46′24″W / 39.88167°N 98.77333°W | |
| Webster | 76275 | 47 | 0.51 (1.31) | 92.76 (35.82) | 0.02 (0.01) | 0.02% | 39°42′27″N 98°34′8″W / 39.70750°N 98.56889°W | |
| White Rock | 78000 | 49 | 0.53 (1.37) | 92.88 (35.86) | 0.04 (0.02) | 0.04% | 39°52′37″N 98°33′5″W / 39.87694°N 98.55139°W |
See also
- Community information for Kansas
- Kansas locations by per capita income
- List of counties in Kansas
- List of townships in Kansas
- List of cities in Kansas
- List of unincorporated communities in Kansas
- List of ghost towns in Kansas
References
- ^ a b c "QuickFacts; Smith County, Kansas; Population, Census, 2020 & 2010". United States Census Bureau. Archived from the original on August 20, 2021. Retrieved August 20, 2021.
- ^ "Find a County". National Association of Counties. Retrieved June 7, 2011.
- ^ "Population and Geographic Centers" (PDF). www.census.gov. Archived (PDF) from the original on September 20, 2008. Retrieved March 6, 2014.
- ^ Kansas Historical Society (October 2015). "Smith County, Kansas". Kansapedia. Retrieved May 21, 2019.
- ^ Kansas Historical Society (December 2014). "Brewster Higley". Kansapedia. Retrieved May 21, 2019.
- ^ "US Gazetteer files: 2010, 2000, and 1990". United States Census Bureau. February 12, 2011. Retrieved April 23, 2011.
- ^ Geographic Center of the Lower 48 United States
- ^ "Annual Estimates of the Resident Population for Counties: April 1, 2020 to July 1, 2023". United States Census Bureau. Retrieved April 3, 2024.
- ^ "U.S. Decennial Census". United States Census Bureau. Retrieved July 29, 2014.
- ^ "Historical Census Browser". University of Virginia Library. Retrieved July 29, 2014.
- ^ "Population of Counties by Decennial Census: 1900 to 1990". United States Census Bureau. Retrieved July 29, 2014.
- ^ "Census 2000 PHC-T-4. Ranking Tables for Counties: 1990 and 2000" (PDF). United States Census Bureau. Archived (PDF) from the original on March 27, 2010. Retrieved July 29, 2014.
- ^ "U.S. Census website". United States Census Bureau. Retrieved January 31, 2008.
- ^ "Dave Leip's Atlas of U.S. Presidential Elections".
- ^ "Map of Wet and Dry Counties". Alcoholic Beverage Control, Kansas Department of Revenue. November 2006. Archived from the original on October 8, 2007. Retrieved December 26, 2007.
Further reading
- Standard Atlas of Smith County, Kansas; Geo. A. Ogle & Co; 82 pages; 1917.
- Plat Book of Smith County, Kansas; North West Publishing Co; 48 pages; 1900.
External links
- County
- Other
- Maps
- Smith County Maps: Current, Historic, KDOT
- Kansas Highway Maps: Current, Historic, KDOT
- Kansas Railroad Maps: Current, 1996, 1915, KDOT and Kansas Historical Society
Places adjacent to Smith County, Kansas | ||||||||||||||||
|---|---|---|---|---|---|---|---|---|---|---|---|---|---|---|---|---|
| ||||||||||||||||
Municipalities and communities of Smith County, Kansas, United States | ||
|---|---|---|
| Cities | 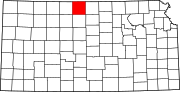 | |
| Unincorporated communities | ||
| Ghost towns | ||
| Townships | ||
| ||
| International | |
|---|---|
| National | |