
South Gloucestershire Council elections
Kingswood and Northavon districts, and also taking on the services previously provided by the former Avon County Council
in the area.
Council elections
- 1995 South Gloucestershire Council election
- 1999 South Gloucestershire Council election (New ward boundaries)[1]
- 2003 South Gloucestershire Council election[2]
- 2007 South Gloucestershire Council election (New ward boundaries)[3]
- 2011 South Gloucestershire Council election
- 2015 South Gloucestershire Council election
- 2019 South Gloucestershire Council election (New ward boundaries)[4]
- 2023 South Gloucestershire Council election
Results maps
-
 2015 results map
 -
 2019 results map
 -
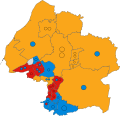 2023 results map


By-election results
1995–1999
| Party | Candidate | Votes | % | ±% | |
|---|---|---|---|---|---|
| Labour | 1,357 | 54.5 | |||
| Liberal Democrats | 570 | 22.9 | |||
| Conservative | 561 | 22.5 | |||
| Majority | 787 | 31.6 | |||
| Turnout | 2,488 | 29.4 | |||
| Labour hold | Swing | ||||
1999–2003
| Party | Candidate | Votes | % | ±% | |
|---|---|---|---|---|---|
| Conservative | 1,061 | 48.1 | +14.2 | ||
| Labour | 768 | 34.8 | +2.7 | ||
| Liberal Democrats | 379 | 17.2 | -16.8 | ||
| Majority | 293 | 13.3 | |||
| Turnout | 2,208 | 39.7 | |||
| Conservative hold | Swing | ||||
| Party | Candidate | Votes | % | ±% | |
|---|---|---|---|---|---|
| Liberal Democrats | 575 | 63.2 | +1.8 | ||
| Conservative | 194 | 21.3 | +8.7 | ||
| Labour | 141 | 15.5 | -10.5 | ||
| Majority | 381 | 41.9 | |||
| Turnout | 910 | 17.9 | |||
| Liberal Democrats hold | Swing | ||||
| Party | Candidate | Votes | % | ±% | |
|---|---|---|---|---|---|
| Conservative | 1,220 | ||||
| Conservative | 1,127 | ||||
| Liberal Democrats | 797 | ||||
| Liberal Democrats | 787 | ||||
| Labour | 734 | ||||
| Labour | 681 | ||||
| Turnout | 5,346 | 33.7 | |||
| Conservative gain from Labour | Swing | ||||
| Conservative gain from Labour | Swing | ||||
| Party | Candidate | Votes | % | ±% | |
|---|---|---|---|---|---|
| Liberal Democrats | 430 | 51.7 | -6.2 | ||
| Conservative | 273 | 32.8 | +7.9 | ||
| Labour | 129 | 15.5 | -1.7 | ||
| Majority | 157 | 18.9 | |||
| Turnout | 832 | 27.1 | |||
| Liberal Democrats hold | Swing | ||||
| Party | Candidate | Votes | % | ±% | |
|---|---|---|---|---|---|
| Labour | 1,303 | 55.0 | -9.8 | ||
| Conservative | 770 | 32.5 | +13.1 | ||
| Liberal Democrats | 294 | 12.4 | -3.4 | ||
| Majority | 533 | 22.5 | |||
| Turnout | 2,367 | 29.3 | |||
| Labour hold | Swing | ||||
2003–2007
| Party | Candidate | Votes | % | ±% | |
|---|---|---|---|---|---|
| Liberal Democrats | 487 | 44.8 | -8.5 | ||
| Conservative | 458 | 42.1 | +13.2 | ||
| Labour | 142 | 13.1 | -4.7 | ||
| Majority | 29 | 2.7 | |||
| Turnout | 1,087 | 34.6 | |||
| Liberal Democrats hold | Swing | ||||
| Party | Candidate | Votes | % | ±% | |
|---|---|---|---|---|---|
| Conservative | 1,036 | 56.6 | -6.9 | ||
| Liberal Democrats | 422 | 23.0 | +9.1 | ||
| Labour | 373 | 20.4 | -2.1 | ||
| Majority | 614 | 33.6 | |||
| Turnout | 1,831 | 31.7 | |||
| Conservative hold | Swing | ||||
2007–2011
| Party | Candidate | Votes | % | ±% | |
|---|---|---|---|---|---|
| Liberal Democrats | Dave Hockey | 1,624 | |||
| Liberal Democrats | Pat Hockey | 1,546 | |||
| Conservative | John Farbrother | 1,179 | |||
| Conservative | Sarah Kitching | 1,165 | |||
| Labour | Terry Trollope | 225 | |||
| Labour | Ray Bazeley | 162 | |||
| Turnout | 5,901 | 54.0 | |||
| Liberal Democrats hold | Swing | ||||
2011–2015
| Party | Candidate | Votes | % | ±% | |
|---|---|---|---|---|---|
| Liberal Democrats | Tony Davis | 787 | 56.9 | -7.3 | |
| Labour | Michael McGrath | 243 | 17.6 | +3.5 | |
| UKIP | Aaron Foot | 213 | 15.4 | +15.4 | |
| Conservative | Kate Duffy | 139 | 10.1 | -11.6 | |
| Majority | 544 | 39.4 | |||
| Turnout | 1,382 | ||||
| Liberal Democrats hold | Swing | ||||
2015–2019
| Party | Candidate | Votes | % | ±% | |
|---|---|---|---|---|---|
| Conservative | Nic Labuschagne | 873 | 47.9 | +1.5 | |
| Labour | George Angus | 615 | 33.8 | +18.6 | |
| Liberal Democrats | Peter Bruce | 333 | 18.3 | -3.8 | |
| Majority | 258 | 14.2 | |||
| Turnout | 1,821 | ||||
| Conservative hold | Swing | ||||
| Party | Candidate | Votes | % | ±% | |
|---|---|---|---|---|---|
| Liberal Democrats | Louise Harris | 693 | 49.0 | +8.1 | |
| Conservative | Ian Livermore | 564 | 39.9 | +17.3 | |
| Labour | John Malone | 158 | 11.2 | -1.6 | |
| Majority | 129 | 9.1 | |||
| Turnout | 1,415 | ||||
| Liberal Democrats hold | Swing | ||||
2019–2023
| Party | Candidate | Votes | % | ±% | |
|---|---|---|---|---|---|
| Conservative | Liz Brennan | 1,819 | 37.8 | -6.5 | |
| Liberal Democrats | Raj Sood | 1,598 | 33.2 | +13.0 | |
| Labour | Sean Rhodes | 1,049 | 21.8 | -3.0 | |
| Green | Oliver Owen | 347 | 7.2 | +7.2 | |
| Majority | 221 | 4.6 | |||
| Turnout | 4,813 | ||||
| Conservative hold | Swing | ||||
References
- ^ "The District of South Gloucestershire (Electoral Changes) Order 1998". legislation.gov.uk. 3 November 1998. Retrieved 4 October 2015.
- ^ "South Gloucestershire". BBC News Online. Retrieved 16 August 2009.
- ^ "The District of South Gloucestershire (Electoral Changes) Order 2007". legislation.gov.uk. 25 January 2007. Retrieved 3 November 2015.
- ^ "The District of South Gloucestershire (Electoral Changes) Order 2018". legislation.gov.uk. 26 April 2018. Retrieved 3 May 2019.
- ^ "View district candidates (by name)". South Gloucestershire Council. Retrieved 16 August 2009.
- ^ "Local Elections Archive Project — Dodington Ward". www.andrewteale.me.uk. Retrieved 11 March 2024.
- ^ "Local Elections Archive Project — Winterbourne Ward". www.andrewteale.me.uk. Retrieved 11 March 2024.
- ^ "Local Elections Archive Project — Dodington Ward". www.andrewteale.me.uk. Retrieved 11 March 2024.
- ^ "Local Elections Archive Project — Frenchay and Downend Ward". www.andrewteale.me.uk. Retrieved 11 March 2024.
