
Staple food


A staple food, food staple, or simply staple, is a
Early
Type
Staple foods are derived from either
Demographics


The dominant staple foods in different parts of the world are a function of weather patterns, local terrain, farming constraints, acquired tastes and ecosystems. For example, the main energy source staples in the average African diet are cereals (46 percent), roots and tubers (20 percent) and animal products (7 percent). In Western Europe the main staples in the average diet are animal products (33 percent), cereals (26 percent), and roots and tubers (4 percent).
Most of the human population lives on a diet based on one or more of the following staples: cereals (
Just 15 plant crops provide 90 percent of the world's food energy intake (exclusive of meat), with rice, maize, and wheat comprising 2/3 of human food consumption. These three are the staples of about 80 percent of the world population,[8] and rice feeds almost half of humanity.
Roots and tubers, meanwhile, are important staples for over one billion people in the
With economic development and free trade, many countries have shifted away from low-
Some foods like
Production
Most staple food is currently produced using modern,
| World production, 2012[13] |
Average world yield, 2010 |
World's most productive countries,[14] 2012[15] |
World's largest producing countries,
2013[16] | ||||
|---|---|---|---|---|---|---|---|
| Rank | Crop | (metric tons) | (tons per hectare) | (tons per hectare) | Country | (metric tons) | Country |
| 1 | Maize (Corn) | 873 million | 5.1 | 11.1[17] | United States | 354 million | United States |
| 2 | Rice | 738 million | 4.3 | 9.5 | Egypt | 204 million | China |
| 3 | Wheat | 671 million | 3.1 | 8.9 | New Zealand | 122 million | China |
| 4 | Potatoes | 365 million | 17.2 | 45.4 | Netherlands | 96 million | China |
| 5 | Cassava | 269 million | 12.5 | 34.8 | Indonesia | 47 million | Nigeria |
| 6 | Soybeans | 241 million | 2.4 | 4.4 | Egypt | 91 million | United States |
| 7 | Sweet potatoes | 108 million | 13.5 | 33.3 | Senegal | 71 million | China |
| 8 | Yams | 59.5 million | 10.5 | 28.3 | Colombia | 36 million | Nigeria |
| 9 | Sorghum | 57.0 million | 1.5 | 4.5 | United States | 10 million | United States |
| 10 | Plantain |
37.2 million | 6.3 | 31.1 | El Salvador | 9 million | Uganda |
Processing
Rice is most commonly cooked and eaten as separate entire grains, but most other staple cereals are milled into a
Nutrition
Consumed in isolation, staple foods do not provide the full range of
Comparison of 10 staple foods
The following table shows the nutrient content of 10 major staple vegetable foods in raw form on a dry weight basis to account for their different water contents. Raw grains are not edible and cannot be digested, so must be cooked, sprouted, or otherwise prepared for human consumption. In sprouted and cooked form, the relative nutritional and anti-nutritional contents of each of these grains is different from that of the raw form of these grains, as shown. Potatoes also must be cooked, but should not be sprouted. The highlighted values show the highest nutrient density among these 10 staples. Other foods, consumed in smaller quantities, may have nutrient densities different from these values.
| Staple | Maize (corn)[A] | Rice, white[B] | Wheat[C] | Potatoes[D] | Cassava[E] | Soybeans, green[F] | Sweet potatoes[G] | Yams[Y] | Sorghum[H] | Plantain[Z] | RDA
|
|---|---|---|---|---|---|---|---|---|---|---|---|
| Water content (%) | 10 | 12 | 13 | 79 | 60 | 68 | 77 | 70 | 9 | 65 | |
| Raw grams per 100 g dry weight | 111 | 114 | 115 | 476 | 250 | 313 | 435 | 333 | 110 | 286 | |
| Nutrient | |||||||||||
| Energy (kJ) | 1698 | 1736 | 1574 | 1533 | 1675 | 1922 | 1565 | 1647 | 1559 | 1460 | 8,368–10,460 |
| Protein (g) | 10.4 | 8.1 | 14.5 | 9.5 | 3.5 | 40.6 | 7.0 | 5.0 | 12.4 | 3.7 | 50 |
| Fat (g) | 5.3 | 0.8 | 1.8 | 0.4 | 0.7 | 21.6 | 0.2 | 0.6 | 3.6 | 1.1 | 44–77 |
| Carbohydrates (g) | 82 | 91 | 82 | 81 | 95 | 34 | 87 | 93 | 82 | 91 | 130 |
| Fiber (g) | 8.1 | 1.5 | 14.0 | 10.5 | 4.5 | 13.1 | 13.0 | 13.7 | 6.9 | 6.6 | 30 |
| Sugar (g) | 0.7 | 0.1 | 0.5 | 3.7 | 4.3 | 0.0 | 18.2 | 1.7 | 0.0 | 42.9 | minimal |
| Minerals | [A] | [B] | [C] | [D] | [E] | [F] | [G] | [Y] | [H] | [Z] | RDA
|
| Calcium (mg) | 8 | 32 | 33 | 57 | 40 | 616 | 130 | 57 | 31 | 9 | 1,000 |
| Iron (mg) | 3.01 | 0.91 | 3.67 | 3.71 | 0.68 | 11.09 | 2.65 | 1.80 | 4.84 | 1.71 | 8 |
| Magnesium (mg) | 141 | 28 | 145 | 110 | 53 | 203 | 109 | 70 | 0 | 106 | 400 |
Phosphorus (mg)
|
233 | 131 | 331 | 271 | 68 | 606 | 204 | 183 | 315 | 97 | 700 |
| Potassium (mg) | 319 | 131 | 417 | 2005 | 678 | 1938 | 1465 | 2720 | 385 | 1426 | 4700 |
| Sodium (mg) | 39 | 6 | 2 | 29 | 35 | 47 | 239 | 30 | 7 | 11 | 1,500 |
Zinc (mg)
|
2.46 | 1.24 | 3.05 | 1.38 | 0.85 | 3.09 | 1.30 | 0.80 | 0.00 | 0.40 | 11 |
Copper (mg)
|
0.34 | 0.25 | 0.49 | 0.52 | 0.25 | 0.41 | 0.65 | 0.60 | - | 0.23 | 0.9 |
Manganese (mg)
|
0.54 | 1.24 | 4.59 | 0.71 | 0.95 | 1.72 | 1.13 | 1.33 | - | - | 2.3 |
| Selenium (μg) | 17.2 | 17.2 | 81.3 | 1.4 | 1.8 | 4.7 | 2.6 | 2.3 | 0.0 | 4.3 | 55 |
| Vitamins | [A] | [B] | [C] | [D] | [E] | [F] | [G] | [Y] | [H] | [Z] | RDA
|
| Vitamin C (mg) | 0.0 | 0.0 | 0.0 | 93.8 | 51.5 | 90.6 | 10.4 | 57.0 | 0.0 | 52.6 | 90 |
Thiamin (B1) (mg)
|
0.43 | 0.08 | 0.34 | 0.38 | 0.23 | 1.38 | 0.35 | 0.37 | 0.26 | 0.14 | 1.2 |
| Riboflavin (B2) (mg) | 0.22 | 0.06 | 0.14 | 0.14 | 0.13 | 0.56 | 0.26 | 0.10 | 0.15 | 0.14 | 1.3 |
Niacin (B3) (mg)
|
4.03 | 1.82 | 6.28 | 5.00 | 2.13 | 5.16 | 2.43 | 1.83 | 3.22 | 1.97 | 16 |
| Pantothenic acid (B5) (mg) | 0.47 | 1.15 | 1.09 | 1.43 | 0.28 | 0.47 | 3.48 | 1.03 | - | 0.74 | 5 |
| Vitamin B6 (mg) | 0.69 | 0.18 | 0.34 | 1.43 | 0.23 | 0.22 | 0.91 | 0.97 | - | 0.86 | 1.3 |
| Folate Total (B9) (μg) | 21 | 9 | 44 | 76 | 68 | 516 | 48 | 77 | 0 | 63 | 400 |
| Vitamin A (IU) | 238 | 0 | 10 | 10 | 33 | 563 | 4178 | 460 | 0 | 3220 | 5000 |
| Vitamin E, alpha-tocopherol (mg) | 0.54 | 0.13 | 1.16 | 0.05 | 0.48 | 0.00 | 1.13 | 1.30 | 0.00 | 0.40 | 15 |
Vitamin K1 (μg)
|
0.3 | 0.1 | 2.2 | 9.0 | 4.8 | 0.0 | 7.8 | 8.7 | 0.0 | 2.0 | 120 |
Beta-carotene (μg)
|
108 | 0 | 6 | 5 | 20 | 0 | 36996 | 277 | 0 | 1306 | 10500 |
| Lutein+zeaxanthin (μg) | 1506 | 0 | 253 | 38 | 0 | 0 | 0 | 0 | 0 | 86 | 6000 |
| Fats | [A] | [B] | [C] | [D] | [E] | [F] | [G] | [Y] | [H] | [Z] | RDA
|
| Saturated fatty acids (g) | 0.74 | 0.20 | 0.30 | 0.14 | 0.18 | 2.47 | 0.09 | 0.13 | 0.51 | 0.40 | minimal |
| Monounsaturated fatty acids (g) | 1.39 | 0.24 | 0.23 | 0.00 | 0.20 | 4.00 | 0.00 | 0.03 | 1.09 | 0.09 | 22–55 |
| Polyunsaturated fatty acids (g) | 2.40 | 0.20 | 0.72 | 0.19 | 0.13 | 10.00 | 0.04 | 0.27 | 1.51 | 0.20 | 13–19 |
| [A] | [B] | [C] | [D] | [E] | [F] | [G] | [Y] | [H] | [Z] | RDA
|
A raw yellow dent corn
B raw unenriched long-grain white rice
C raw hard red winter wheat
D raw potato with flesh and skin
E raw cassava
F raw green soybeans
G raw sweet potato
H raw sorghum
Y raw yam
Z raw plantains
/* unofficial
Images
-
 White rice, cooked
 -

-

-

-
 Maize (corn)
 -

-
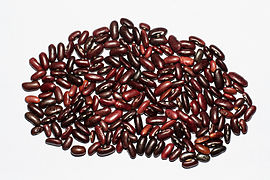 Kidney beans
 -
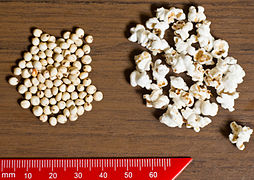 Sorghum seeds and popped sorghum
 -
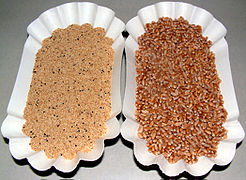
 Millet grains
 -
-
 Colored quinoa
 -
 Cassava roots
 -

-
 Sweet potato salad
 -
 Ullucotubers
 -
 Oca tubers
 -
 Taro roots
 -

-


_by_David_Adam_Kess_(pic.2).jpg)


See also
- Cash crop
- Subsistence agriculture
- Famine food
- Vavilov centers
References
- ^ S2CID 40398017.
- ^ a b United Nations Food and Agriculture Organization: Agriculture and Consumer Protection. "Dimensions of Need - Staples: What do people eat?". Retrieved 15 October 2010.
- ^ "Around the world in dishes made with pulses". Food and Agricultural Organisation of the United Nations. 18 November 2015. Retrieved 23 September 2017.
- ISBN 978-1-920901-13-4.
- ^ "African Food Staples". Retrieved 29 May 2015.
- ^ "Olive Oil & Health - All Olive Oil". Retrieved 29 May 2015.
- ^ "How Sugar Went From a Condiment to a Diet Staple". Time.
- Food and Agriculture Organization of the United Nations. 1995.
- ^ E.A. Oelke; et al. "Quinoa". University of Minnesota.
- ^ Arbizu and Tapia (1994). "Plant Production and Protection Series No. 26. FAO, Rome, Italy". FAO / Purdue University.
- ^ John E. Foster. "Pemmican". The Canadian Encyclopedia. Archived from the original on 29 May 2015. Retrieved 29 May 2015.
- ^ Allianz. "Food security: Ten Crops that Feed the World". Allianz.
- ^ "Food and Agricultural commodities production / Commodities by regions". Food and Agriculture Organization of the United Nations. 2012. Archived from the original on 16 June 2016. Retrieved 7 January 2015.
- ^ The numbers in this column are country average; regional farm productivity within the country varies, with some farms even higher.
- ^ "FAOSTAT: Production-Crops, 2010 data". Food and Agriculture Organization of the United Nations. 2011.
- ^ "Food and Agricultural commodities production / Countries by commodity (2013 data)". Food and Agriculture Organization of the United Nations. Retrieved 24 April 2016.
- ^ "USDA Crop Production" (PDF). Retrieved 20 February 2022.
- ^ United Nations Food and Agriculture Organization: Agriculture and Consumer Protection. "Rice and Human Nutrition" (PDF). Retrieved 15 October 2010.
- ^ Wernick, Adam (29 October 2017). "Global warming threatens nutrition levels in staple crops". Public Radio International (PRI). Retrieved 30 October 2017.
- ^ "Nutrient data laboratory". United States Department of Agriculture. Retrieved August 10, 2016.
External links
 Media related to Staple foods at Wikimedia Commons
| Dieting |
| ||||||||||||||||||||||||
|---|---|---|---|---|---|---|---|---|---|---|---|---|---|---|---|---|---|---|---|---|---|---|---|---|---|
| Nutrition |
| ||||||||||||||||||||||||
| Nutritional advice | |||||||||||||||||||||||||
| Authority control databases: National |
|---|