
2010 United States elections
| ← 2008 2009 2010 2011 2012 → Midterm elections | |
| Election day | November 2 |
|---|---|
| Incumbent president | Barack Obama (Democratic) |
| Next Congress | 112th |
| Senate elections | |
| Overall control | Democratic hold |
| Seats contested | 38 of 100 seats (34 seats of Class III + 5 special elections)[1] |
| Net seat change | Republican +6 |
 | |
| 2010 Senate election results map Republican gain Democratic hold Republican hold | |
| House elections | |
| Overall control | Republican gain |
| Seats contested | All 435 voting seats |
| Popular vote margin | Republican +6.8% |
| Net seat change | Republican +63 |
 | |
| 2010 House election results map Democratic hold Republican hold Democratic gain Republican gain | |
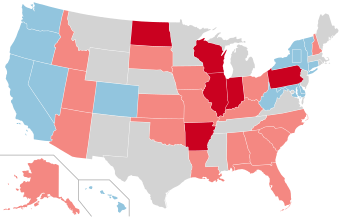
| Gubernatorial elections | |
| Seats contested | 39 (37 states, 2 territories) |
| Net seat change | Republican +6 |
 | |
| 2010 Gubernatorial election results map Democratic gain Republican gain Democratic hold Republican hold Independent gain | |
The 2010 United States elections were held on Tuesday, November 2, 2010, in the middle of Democratic President Barack Obama's first term. Republicans ended unified Democratic control of Congress and the presidency by winning a majority in the House of Representatives and gained seats in the Senate despite Democrats holding Senate control.
Republicans gained seven seats in the Senate (including a special election held in January 2010) but failed to gain a majority in the chamber. In the House of Representatives, Republicans won a net gain of 63 seats, the largest shift in seats since the 1948 elections. In state elections, Republicans won a net gain of six gubernatorial seats and flipped control of twenty state legislative chambers, giving them a substantial advantage in the redistricting that occurred following the 2010 United States census. The election was widely characterized as a "Republican wave" election.
The heavy Democratic losses in 2010 were mainly attributed to the passing of the Affordable Care Act along with a poor economic recovery from the Great Recession and large budget deficits. This marked the first election since 1858 that yielded a Republican-controlled House and a Democratic-controlled Senate. This configuration was also in place for most of the 107th Congress, but on account of Senator Jim Jeffords' party switch rather than the election results.
Issues
Candidates and voters in 2010 focused on national economic conditions and the economic policies of the Obama administration and congressional Democrats. Attention was paid to public anger over the
The fiscally-focused and quasi-libertarian Tea Party movement was a vocal force in mobilizing voters for Republican candidates nationwide. Their widespread exposure in the media contributed to the election's focus on economic, rather than social, issues. In the opinion of Fox News political analyst Dick Morris, a "fundamental change" occurred in which social issues did not dominate Republican activism in 2010, because "economic and fiscal issues prevail. The Tea Party has made the Republican Party safe for libertarians."[3]
Immigration reform had become an important issue in 2010, particularly following the passage of
The passage of the controversial
Federal elections
Congressional elections
Senate elections
On January 19, 2010, a special election was also held for the Class I seat in Massachusetts, as a result of the death of incumbent Senator Ted Kennedy. Republican Scott Brown won the seat.
The 34 seats in the
House of Representatives elections
All 435 voting seats in the
State elections

Gubernatorial elections
37 state and two territory United States governors were up for election. Republicans picked up a net of six state governorships; Democrats won control of five governorships previously controlled by Republicans, but Republicans took 11 governorships.
Other statewide elections
In many states where the following positions are elected offices, voters elected state executive branch offices (including
State legislative elections
Republicans scored record gains, gaining at least 680 total seats and taking control of 20 legislative chambers through election, while the Democrats lost 21 chambers.[7][8] The winners of this election cycle were slated to serve in their respective legislatures for either two or four-year terms, depending on state election rules.
Republicans made substantial gains in state legislatures across the nation. Twenty chambers flipped from Democratic to Republican control, giving Republicans full control of eleven state legislatures and control of one chamber in Colorado, Iowa, and New York.1[9] Additionally, Republicans gained enough seats in the Oregon House of Representatives to produce a 30-30 party split, pushing Democrats into a power-sharing agreement that resulted in the election of two "co-speakers" (one from each party) to lead the chamber.[10] Republicans gained a total of 680 seats in state legislative races, breaking the previous record of 628 flipped seats set by Democrats in the post-Watergate elections of 1974.[11]
Six states saw both chambers switch from Democrat to Republican majorities: Alabama (where the Republicans won a majority and a trifecta for the first time since 1874), Maine (for the first time since 1964), Minnesota (for the first time since 1915 in partisan elections and 1973 in non-partisan elections), New Hampshire, North Carolina (for the first time since 1896), and Wisconsin. In addition, by picking up the lower chambers in Indiana, Ohio, Michigan, Montana[a] and Pennsylvania, Republicans gained control of both chambers in an additional five states. Further, Republicans picked up one chamber from Democrats in Colorado, Iowa, and New York to split control in those states. They expanded majorities in both chambers in Texas, Florida, and Georgia. The massive Republican victories in legislative races would be widely expected to significantly impact the redrawing of congressional districts for the 2012 election cycle.
Local elections
On November 2, 2010, various cities, counties, school boards, and special districts (in the United States) witnessed elections. Some elections were high-profile.
- council-manager form of government. The following year (in 2011), the first general election for the new assembly was held. The first council members were sworn in on January 2, 2012.[14]
High-profile mayoral elections are listed below:
- Honolulu, Hawaii: Incumbent mayor Mufi Hannemann resigned on July 20, 2010, to run for Governor of Hawaii. The city's Managing Director Kirk Caldwell served as acting mayor until Peter Carlislewas elected in a special election on September 18.
- Louisville, Kentucky: Incumbent mayor Jerry Abramson declined to run for a third consecutive term in order to run for Lieutenant Governor of Kentucky in 2011. Greg Fischerwas elected as the successor.
- New Orleans, Louisiana: Incumbent mayor Ray Nagin was term-limited out of office. Mitch Landrieuwas elected as the new mayor on February 6.
- Washington, D.C: Incumbent mayor Adrian Fenty was defeated in the Democratic primary by Vincent C. Gray, who then went on to win the general election.
Turnout
Approximately 82.5 million people voted.
Table of federal and state results
Bold indicates a change in control. Note that not all states held gubernatorial, state legislative, and United States Senate elections in 2010.
| State[17] | Before 2010 elections[18] | After 2010 elections[19] | ||||||||
|---|---|---|---|---|---|---|---|---|---|---|
| State | PVI
|
Governor | State leg. | US Senate
|
US House
|
Governor | State leg. | US Senate
|
US House
| |
| Alabama | R+13 | Rep | Dem | Rep | Rep 5–2 | Rep | Rep | Rep | Rep 6–1 | |
| Alaska | R+13 | Rep | Split | Split | Rep 1–0 | Rep | Split | Split | Rep 1–0 | |
| Arizona | R+6 | Rep | Rep | Rep | Dem 5–3 | Rep | Rep | Rep | Rep 5–3 | |
| Arkansas | R+9 | Dem | Dem | Dem | Dem 3–1 | Dem | Dem | Split | Rep 3–1 | |
| California | D+7 | Rep | Dem | Dem | Dem 34–19 | Dem | Dem | Dem | Dem 34–19 | |
| Colorado | Even | Dem | Dem | Dem | Dem 5–2 | Dem | Split | Dem | Rep 4–3 | |
| Connecticut | D+7 | Rep | Dem | Split D/I[b] | Dem 5–0 | Dem | Dem | Split D/I[b] | Dem 5–0 | |
| Delaware | D+7 | Dem | Dem | Dem | Rep 1–0 | Dem | Dem | Dem | Dem 1–0 | |
| Florida | R+2 | Ind | Rep | Split | Rep 15–10 | Rep | Rep | Split | Rep 19–6 | |
| Georgia | R+7 | Rep | Rep | Rep | Rep 7–6 | Rep | Rep | Rep | Rep 8–5 | |
| Hawaii | D+12 | Rep | Dem | Dem | Split 1–1 | Dem | Dem | Dem | Dem 2–0 | |
| Idaho | R+17 | Rep | Rep | Rep | Split 1–1 | Rep | Rep | Rep | Rep 2–0 | |
| Illinois | D+8 | Dem | Dem | Dem | Dem 12–7 | Dem | Dem | Split | Rep 11–8 | |
| Indiana | R+6 | Rep | Split | Split | Dem 5–3 | Rep | Rep | Rep | Rep 6–3 | |
| Iowa | D+1 | Dem | Dem | Split | Dem 3–2 | Rep | Split | Split | Dem 3–2 | |
| Kansas | R+11 | Dem | Rep | Rep | Rep 3–1 | Rep | Rep | Rep | Rep 4–0 | |
| Kentucky | R+10 | Dem | Split | Rep | Rep 4–2 | Dem | Split | Rep | Rep 4–2 | |
| Louisiana | R+10 | Rep | Dem | Split | Rep 6–1 | Rep | Dem | Split | Rep 6–1 | |
| Maine | D+5 | Dem | Dem | Rep | Dem 2–0 | Rep | Rep | Rep | Dem 2–0 | |
| Maryland | D+9 | Dem | Dem | Dem | Dem 7–1 | Dem | Dem | Dem | Dem 6–2 | |
| Massachusetts | D+12 | Dem | Dem | Split | Dem 10–0 | Dem | Dem | Split | Dem 10–0 | |
| Michigan | D+4 | Dem | Split | Dem | Dem 8–7 | Rep | Rep | Dem | Rep 9–6 | |
| Minnesota | D+2 | Rep | Dem | Dem | Dem 5–3 | Dem | Rep | Dem | Split 4–4 | |
| Mississippi | R+10 | Rep | Dem | Rep | Dem 3–1 | Rep | Dem | Rep | Rep 3–1 | |
| Missouri | R+3 | Dem | Rep | Split | Rep 5–4 | Dem | Rep | Split | Rep 6–3 | |
| Montana | R+7 | Dem | Split | Dem | Rep 1–0 | Dem | Rep | Dem | Rep 1–0 | |
| Nebraska | R+13 | Rep | NP | Split | Rep 3–0 | Rep | NP | Split | Rep 3–0 | |
| Nevada | D+1 | Rep | Dem | Split | Dem 2–1 | Rep | Dem | Split | Rep 2–1 | |
| New Hampshire | D+2 | Dem | Dem | Split | Dem 2–0 | Dem | Rep | Split | Rep 2–0 | |
| New Jersey | D+4 | Rep | Dem | Dem | Dem 8–5 | Rep | Dem | Dem | Dem 7–6 | |
| New Mexico | D+2 | Dem | Dem | Dem | Dem 3–0 | Rep | Dem | Dem | Dem 2–1 | |
| New York | D+10 | Dem | Dem | Dem | Dem 26–2 | Dem | Split | Dem | Dem 21–8 | |
| North Carolina | R+4 | Dem | Dem | Split | Dem 8–5 | Dem | Rep | Split | Dem 7–6 | |
| North Dakota | R+10 | Rep | Rep | Dem | Dem 1–0 | Rep | Rep | Split | Rep 1–0 | |
| Ohio | R+1 | Dem | Split | Split | Dem 10–8 | Rep | Rep | Split | Rep 13–5 | |
| Oklahoma | R+17 | Dem | Rep | Rep | Rep 4–1 | Rep | Rep | Rep | Rep 4–1 | |
| Oregon | D+4 | Dem | Dem | Dem | Dem 4–1 | Dem | Split | Dem | Dem 4–1 | |
| Pennsylvania | D+2 | Dem | Split | Dem | Dem 12–7 | Rep | Rep | Spilt | Rep 12–7 | |
| Rhode Island | D+11 | Rep | Dem | Dem | Dem 2–0 | Ind | Dem | Dem | Dem 2–0 | |
| South Carolina | R+8 | Rep | Rep | Rep | Rep 4–2 | Rep | Rep | Rep | Rep 5–1 | |
| South Dakota | R+9 | Rep | Rep | Split | Dem 1–0 | Rep | Rep | Split | Rep 1–0 | |
| Tennessee | R+9 | Dem | Rep | Rep | Dem 5–4 | Rep | Rep | Rep | Rep 7–2 | |
| Texas | R+10 | Rep | Rep | Rep | Rep 20–12 | Rep | Rep | Rep | Rep 23–9 | |
| Utah | R+20 | Rep | Rep | Rep | Rep 2–1 | Rep | Rep | Rep | Rep 2–1 | |
| Vermont | D+13 | Rep | Dem | Split D/I[c] | Dem 1–0 | Dem | Dem | Split D/I[c] | Dem 1–0 | |
| Virginia | R+2 | Rep | Split | Dem | Dem 6–5 | Rep | Split | Dem | Rep 8–3 | |
Washington
|
D+5 | Dem | Dem | Dem | Dem 6–3 | Dem | Dem | Dem | Dem 5–4 | |
| West Virginia | R+8 | Dem | Dem | Dem | Dem 2–1 | Dem | Dem | Dem | Rep 2–1 | |
| Wisconsin | D+2 | Dem | Dem | Dem | Dem 5–3 | Rep | Rep | Split | Rep 5–3 | |
| Wyoming | R+20 | Dem | Rep | Rep | Rep 1–0 | Rep | Rep | Rep | Rep 1–0 | |
| United States | Even | Dem 26–23 | Dem 27–14 | Dem 59–41 | Dem 255–178 | Rep 29–20 | Rep 25–16 | Dem 53–47 | Rep 242–193 | |
| Washington, D.C. | D+43 | Dem[d] | Dem[d] | — | Dem | Dem | Dem | — | Dem | |
| American Samoa | — | NP/D[e] | NP | Dem | NP/D[e] | NP | Dem | |||
| Guam | Rep | Dem | Dem | Rep | Dem | Dem | ||||
| N. Mariana Islands | CP | Rep | Ind[f] | CP | Rep | Dem[g] | ||||
| Puerto Rico | PNP/R[h] | PNP | PNP/D[i] | PNP/R[h] | PNP | PNP/D[i] | ||||
| U.S. Virgin Islands | Dem | Dem | Dem | Dem | Dem | Dem | ||||
| Subdivision | PVI | Governor
|
State leg. | U.S. Senate
|
U.S. House
|
Governor
|
State leg. | U.S. Senate
|
U.S. House
| |
| Subdivision and PVI | Before 2010 elections | After 2010 elections | ||||||||
Notes
- ^ Prior to the 2010 election, the 100 seats in the Montana House of Representatives were evenly split between Democrats and Republicans, but the Democratic Party controlled the chamber by virtue of holding the governor's office.
- ^ a b Joe Lieberman was elected as an independent but continued to caucus with Senate Democrats. Connecticut's other Senator was a Democrat.
- ^ a b Bernie Sanders was elected as an independent but caucused with Senate Democrats. Vermont's other Senator was a Democrat.
- ^ mayor and a city council.
- ^ a b Although elections for governor of American Samoa are non-partisan, Governor Togiola Tulafono affiliates with the Democratic party at the national level.
- ^ Northern Marianas Islands Delegate Gregorio Sablan was elected as an independent in 2008 and caucused with the Democrats in Congress after taking office in 2009.
- ^ Sablan was re-elected as a Democrat in 2010.
- ^ a b Puerto Rican Governor Luis Fortuño is a member of the New Progressive Party but affiliates with the Republican Party at the national level.
- ^ a b Puerto Rico's Resident Commissioner, Pedro Pierluisi, was elected as a member of the New Progressive Party and has caucused with the Democrats since taking office in 2009.
References
- ^ The Class 2 Senate seat in Illinois held concurrent regular and special elections in November 2010. That special election is not included in the total number of seats contested.
- ^ Jeffrey M. Jones, "Americans Give GOP Edge on Most Election Issues; Greatest Republican advantages on terrorism, immigration, federal spending", Gallup, September 1, 2010
- ^ ""The New Republican Right", TheHill.com". Realclearpolitics.com. 2010-10-20. Retrieved 2013-04-20.
- ^ "Statistics of the Congressional Election of November 2, 2010" (PDF). U.S. House of Reps, Office of the Clerk. Retrieved 10 April 2017.
- ^ "In Redistricting Year, GOP Gains a Big Edge". November 4, 2010. Retrieved November 4, 2010.
- ^ "Four More Lessons from the GOP Landslide". November 4, 2010. Archived from the original on November 8, 2010. Retrieved November 4, 2010.
- ^ Memoli, Michael A. (November 3, 2010). "State legislative gains give Republicans unprecedented clout to remake districts - Los Angeles Times". Articles.latimes.com. Retrieved June 4, 2013.
- ^ Balz, Dan (November 14, 2010). "The Republican takeover in the states". Washingtonpost.com. Retrieved June 4, 2013.
- ^ Storey, Tim. "GOP Makes Historic State Legislative Gains in 2010". Rasmussen Reports. Rasmussen Report, LLC. Retrieved 29 July 2014.
- ^ Cole, Michelle (Jan 11, 2011). "Oregon House makes history by electing two co-speakers". The Oregonian. Retrieved 29 July 2014.
- ^ "Devastation: GOP Picks Up 680 State Leg. Seats". November 4, 2010. Archived from the original on October 28, 2012. Retrieved November 4, 2010.
- ^ Voters say 'yes' to home rule - News. Standard Speaker (2010-11-03). Retrieved on 2013-07-23.
- ^ "Luzerne County : Election Results Archive". www.luzernecounty.org. Archived from the original on 11 January 2018. Retrieved 18 March 2018.
- ^ timesleadervideo (2 January 2012). "Luzerne County Council members sworn in - The Times Leader reports". Archived from the original on 2021-11-17. Retrieved 18 March 2018 – via YouTube.
- ^ Tomasky, Michael (November 3, 2010). "Turnout: says a lot". The Guardian. London. Retrieved November 3, 2010.
- ^ "It's the Ideology, Stupid: Midterm elections". The New Republic. November 4, 2010. Retrieved November 4, 2010.
- ^ "Partisan Voter Index by State, 1994-2014" (PDF). Cook Political Report. Archived from the original (PDF) on 27 November 2014. Retrieved 19 May 2016. PVI in 2010
- ^ "2010 State and Legislative Partisan Composition" (PDF). National Conference of State Legislatures. Retrieved 19 May 2016.
- ^ "2011 State and Legislative Partisan Composition" (PDF). National Conference of State Legislatures. Retrieved 19 May 2016.
Further reading
- Abramson, Paul; Aldrich, John; Rohde, David (2010). Change and Continuity in the 2008 Elections. ISBN 9781604265200.
- Bullock, Charles S., et al. Key States, High Stakes: Sarah Palin, the Tea Party, and the 2010 Elections (2011)
- Jacobson, Gary C. (2011). "The Republican Resurgence in 2010". Political Science Quarterly. 126: 27–52. .
- Sabato, Larry. Who Got in the Booth? A Look Back at the 2010 Elections (2011)
External links
- 2010 Midterm Election Debates on C-SPAN
- Wesleyan Media Project: 2010 Political Advertising Analysis at Wesleyan University
- National newspapers
- National radio
- Election 2010 at NPR
- National TV
- 2010 Election at ABC News
- Campaign 2010 on C-SPAN
- Campaign 2010 at CBS News
- Election Center at CNN
- Elections at Fox News
- Decision 2010 at MSNBC