Vaccine efficacy
This article needs additional citations for verification. (March 2007) |
This article is written like a encyclopedic style and simplify overly technical phrases. (August 2021) ) |

Vaccine efficacy or vaccine effectiveness is the percentage reduction of disease cases in a
Vaccine efficacy was designed and calculated by Greenwood and Yule in 1915 for the
Vaccine efficacy studies are used to measure several important and critical outcomes of interest such as disease
Formula
The
The basic formula[7] is written as:
- = Vaccine efficacy,
- = Attack rate of unvaccinated people,
- = Attack rate of vaccinated people.
An alternative, equivalent formulation of vaccine efficacy is:
The design of
Relative risk
First, the baseline risk can be calculated for each group and then vaccine efficacy (RRR) as follows:
- for the vaccinated group (24 infections)
- for the placebo group (106 infections)
- The relative risk,
Then,
Also, the
Testing
Vaccine efficacy differs from vaccine effectiveness in the same way that an explanatory clinical trial differs from an intention-to-treat trial[clarification needed]: vaccine efficacy shows how effective a vaccine could be given ideal circumstances and 100% vaccine uptake (such as the conditions within a controlled clinical trial); vaccine effectiveness measures how well a vaccine performs when it is used in routine circumstances in the community.[9] What makes vaccine efficacy relevant is that it shows the disease attack rates as well as a tracking of vaccination status.[jargon][9] Vaccine effectiveness is relatively inexpensive to measure than vaccine efficacy. The measurement of vaccine effectiveness relies on observational studies which are usually easier to perform, whereas a vaccine efficacy measurement requires randomized controlled trials which are time and capital intensive.[10][9] Because a clinical trial is based on people who are taking the vaccine and those who are not, there is a risk for disease, and optimal treatment is needed for those who become infected.
The advantages of measuring vaccine efficacy is having the ability to control for
Standardized statements of efficacy may be
Cases studied
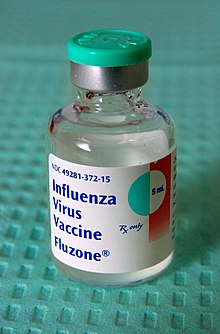
The New England Journal of Medicine did a study on the efficacy of a vaccine for the influenza A virus. A total of 1,952 subjects were enrolled and received study vaccines in the fall of 2007. Influenza activity occurred from January through April 2008, with the circulation of influenza types:
- A (H3N2) (about 90%)
- B(about 9%)
Absolute efficacy against both types of influenza, as measured by isolating the
Since 2004, clinical trials testing the efficacy of the influenza vaccine have been slowly coming in: 2,058 people were vaccinated in October and November 2005. Influenza activity was prolonged but of low intensity; type A (H3N2) was the virus that was generally spreading around the population, which was very like the vaccine itself. The efficacy of the inactivated vaccine was 16% (95% confidence interval [CI], -171% to 70%) for the virus identification end point (virus isolation in cell culture or identification through polymerase chain reaction) and 54% (95% CI, 4%–77%) for the primary end point (virus isolation or increase in
With serologic end points included, efficacy was demonstrated for the inactivated vaccine in a year with low influenza attack rates. Influenza vaccines are effective in reducing cases of influenza, especially when the content predicts accurately circulating types and circulation is high. However, they are less effective in reducing cases of influenza-like illness and have a modest impact on working days lost. There is insufficient evidence to assess their impact on complications.
References
- ^ a b Zimmer, Carl (20 November 2020). "2 Companies Say Their Vaccines Are 95% Effective. What Does That Mean? You might assume that 95 out of every 100 people vaccinated will be protected from Covid-19. But that's not how the math works". The New York Times. Retrieved 21 November 2020.
- ^ a b Principles of Epidemiology in Public Health Practice (3rd ed.), U.S. Department of Health and Human Services and Centers for Disease Control and Prevention (CDC), 2006, pp. 3–49
- ^ (Weinburg, G., & Szilagyi, P. (2010). Vaccine Epidemiology: Efficacy, Effectiveness, and the Translational Research Roadmap. Journal of Infectious Diseases, 201(11), 1607-1610.)
- S2CID 29528780.
- PMID 8569019.
- PMID 3066628.
- PMID 3879673.
- PMID 24700849.
- ^ a b c d e "How flu vaccine effectiveness and efficacy are measured". Centers for Disease Control and Prevention, National Center for Immunization and Respiratory Diseases, US Department of Health and Human Services. 2016-01-29. Retrieved 2020-05-06.
- PMID 27383927.
- PMID 29254838.
- PMID 30976806.
- PMID 25061922.
- PMID 35522748.
- PMID 33125914.
- S2CID 205090564.
- S2CID 235241761.
- ^ Crislip, M (2009-10-09). "Flu Vaccine Efficacy". Science-Based Medicine. Archived from the original on 2020-06-01.
- PMID 18522501.


