
White Americans
 White Americans (alone/one race only) in 2020 | |
| Total population | |
|---|---|
| 235 million (71%) White, in combination with other races 204 million (61.6%) White, one race only [1] | |
| Regions with significant populations | |
| All areas of the United States | |
| Languages | |
| Predominantly English | |
| Religion | |
|
White Americans (also referred to as European Americans) are Americans who identify as white people. This group constitutes the majority of the people in the United States. According to the 2020 census, 71%, or 235,411,507 people, were White alone or in combination, and 61.6%, or 204,277,273 people, were White alone. This represented a national white demographic decline from a 72.4% white alone share of the U.S. population in 2010.
As of July 1, 2022, United States Census Bureau estimates that 75.8% of the US population were white alone, while Non-Hispanic whites were 59.3% of the population.[3] For these population estimates, the 15.1% who identified as "Some Other Race" in 2020[4] were redistributed into other racial categories, with most of them reclassified as white alone.[5] European Americans are the largest panethnic group of white Americans and have constituted the majority population of the United States since the nation's founding.
The U.S. Census Bureau uses a particular definition of "white" that differs from some colloquial uses of the term.[6][7] The Bureau defines "White" people to be those "having origins in any of the original peoples of Europe, the Middle East or North Africa".[8] Within official census definitions, people of all racial categories may be further divided into those who identify as "not Hispanic or Latino" and those who do identify as "Hispanic or Latino".[9][6] The term "non-Hispanic white", rather than just "white", may be the census group corresponding most closely to those persons who identify as and are perceived to be white in common usage; similarly not all Hispanic/Latino people identify as "white", "black", or any other listed racial category.[6][7] In 2015, the Census Bureau announced their intention to make Hispanic/Latino and Middle Eastern/North African racial categories similar to "white" or "black", with respondents able to choose one, two, or more racial categories; this change was canceled during the Trump administration.[7][10] Other persons who are classified as "white" by the U.S. census but may or may not identify as or be perceived as white include Arab Americans and Jewish Americans of European or MENA descent.[11][12][13][14] In the United States, the term White people generally denotes a person of European ancestry, but has been legally extended to people of West Asian and North African (Middle Eastern, West Asian, and North African) ancestry.[15][16][17]
The most commonly reported ancestries of non-Hispanic White Americans include German (13%), Irish (10%), English (9%), Italian (6%), French (4%), Polish (3%), Scottish (3%), Scotch-Irish (2%), and Dutch, Norwegian, Swedish, and Russian (each 1%), respectively.[18][19][20][21] It is difficult to track ancestry from Spain in Whites alone since people of Spanish descent are Hispanic and though the census does track Hispanics' national origin, it does not classify it by race. In 2021, 995,583 people of any race claimed ancestry from Spain, 0.3% of the total population.[22] The British Americans' demography is considered a serious under-count as the stock tend to self-report and identify as simply "Americans" (7%), due to the length of time they have inhabited the United States, particularly if their family arrived prior to the American Revolution.[23][14] The vast majority of white Americans also have ancestry from multiple countries.
Historical and present definitions
Definitions of who is "White" have changed throughout the history of the United States.
U.S. census definition
The term "white American" can encompass many different ethnic groups. Although the
The Census question on race lists the categories
"White" refers to a person having origins in any of the original peoples of Europe, the Middle East or North Africa. It includes people who indicated their race(s) as "White" or reported entries such as German, Italian, Lebanese, Arab, Moroccan, or Caucasian.[8]
In U.S. census documents, the designation White overlaps, as do all other official racial categories, with the term
Beginning in 1930, Mexican was added as a distinct race on the U.S. census with the explanation that "practically all Mexican laborers are of a racial mixture difficult to classify".[29][30] The Mexican racial category was removed in 1940, with new direction that "Mexicans are to be regarded as white unless definitely of Indian or other nonwhite race"; this was continued in 1950.[31] 1970 saw the creation of the Spanish Origin category, which superseded previous classifications for Latin Americans and is now represented by the Hispanic or Latino ethnic category. Hispanic or Latino was again to be raised to racial status for the 2020 census (along with Middle Eastern and North African), but this was canceled by President Donald J. Trump.[32]
The characterization of Middle Eastern and North African Americans as white has been a matter of controversy. In the early 20th century, there were a number of cases where people of Arab descent were denied entry into the United States or deported, because they were characterized as nonwhite.[33] In the early 21st century, MENA Americans began lobbying for the creation of their own racial group and were successful; in 2015, the US Census Bureau announced that it had responded to their requests and would add a "Middle Eastern and North African" racial category to the 2020 census.[34][35] However, the Trump administration nullified this change after coming to power in 2016.


In cases where individuals do not self-identify, the
On some government documents, such as the 2007
Social definition
In the contemporary United States, essentially anyone of European descent is typically considered white. People of Middle Eastern and North African (MENA) descent may also be considered white. However, many of the ethnic groups classified as white by the U.S. Census, such as
Social perceptions of whiteness have evolved over the course of American history. For example, Benjamin Franklin commented that the Saxons of Germany and the English "make the principal Body of White People on the Face of the Earth".[47] Historically, many individuals of European descent were not readily integrated into mainstream American society and found themselves caught on the "dark" side of the white/black binary, including Irish, Italians, Greeks and Slavs.[48] In Minnesota, increasing numbers of Finnish immigrants led to a debate surrounding Finnish whiteness and whether Finns should be classified as a Mongoloid peoples.[46]
David R. Roediger argues that the construction of the white race in the United States was an effort to mentally distance slave owners from slaves.[49] The process of officially being defined as white by law often came about in court disputes over pursuit of citizenship.[50]
Demographic information
| White alone 1790–2020 | |||||||
|---|---|---|---|---|---|---|---|
| Year | Population | % of the U.S. |
% change (10 yr) |
Year | Population | % of the U.S. |
% change (10 yr) |
| 1790 | 3,172,006 | 80.7 | 1910 | 81,731,957 | 88.9 | ||
| 1800 | 4,306,446 | 81.1 | 1920 | 94,820,915 | 89.7 | ||
| 1810 | 5,862,073 | 81.0 | 1930 | 110,286,740 | 89.8 | ||
| 1820 | 7,866,797 | 81.6 | 1940 | 118,214,870 | 89.8 (highest) | ||
| 1830 | 10,532,060 | 81.9 | 1950 | 134,942,028 | 89.5 | ||
| 1840 | 14,189,705 | 83.2 | 1960 | 158,831,732 | 88.6 | ||
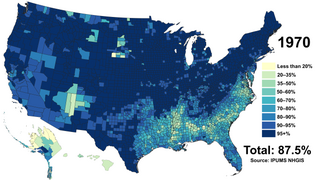
| 1850 | 19,553,068 | 84.3 | 1970 | 178,119,221 | 87.5 | ||
| 1860 | 26,922,537 | 85.6 | 1980 | 188,371,622 | 83.1 | ||
| 1870 | 33,589,377 | 87.1 | 1990 | 199,686,070 | 80.3 | ||
| 1880 | 43,402,970 | 86.5 | 2000 | 211,460,626 | 75.1 | ||
| 1890 | 55,101,258 | 87.5 | 2010 | 223,553,265 | 72.4 | ||
| 1900 | 66,809,196 | 87.9 | 2020 | 204,277,273 | 61.6 (lowest) | ||
| Source: United States census bureau.[51][52][53][54] | |||||||
The
White Americans constitute the majority of the 332 million people living in the United States, with 71% of the population in the
The largest ethnic groups (by ancestry) among White Americans were English, followed by Germans and Irish.[57][58] In the 1980 census 49,598,035 Americans cited that they were of English ancestry, making them 26% of the country and the largest group at the time, and in fact larger than the population of England itself.[59] Slightly more than half of these people would cite that they were of "American" ancestry on subsequent censuses and virtually everywhere that "American" ancestry predominates on the 2000 census corresponds to places where "English" predominated on the 1980 census.[14][60]
Geographic distribution
This section needs to be updated. (August 2020) |

Overall the highest concentration of those referred to as "non-Hispanic whites" by the Census Bureau are found in the
Although all large geographical areas are dominated by White Americans, much larger differences can be seen between specific parts of large cities.
States with the highest percentages of White Americans, either White Alone or in combination with another race as of 2020:[64][failed verification]
- Vermont 95.6%
- Maine 95.4%
- West Virginia 94.4%
- New Hampshire 93.7%
- Wyoming 92.0%
- Montana 90.9%
- Idaho 90.2%
- Iowa 89.8%
- North Dakota 88.0%
- Kentucky 87.5%
States with the highest percentages of non-Latino/Hispanic whites, as of 2020:[65][failed verification]
- Maine 92.0%
- Vermont 91.3%
- New Hampshire 91.3%
- West Virginia 90.4%
- Wyoming 90.7%
- Idaho 90.7%
- Utah 88.7%
- Iowa 88.7%
- Montana 86.7%
- Nebraska 86.0%
Income and educational attainment

This section needs to be updated. (August 2020) |
White Americans have the second highest
The poverty rates for White Americans are the second-lowest of any racial group, with 11% of white individuals living below the poverty line, 3% lower than the national average.[68] However, due to Whites' majority status, 48% of Americans living in poverty are white.[69]
White Americans' educational attainment is the second-highest in the country, after Asian Americans'. Overall, nearly one-third of White Americans had a Bachelor's degree, with the educational attainment for Whites being higher for those born outside the United States: 38% of foreign born, and 30% of native born Whites had a college degree. Both figures are above the national average of 27%.[70]
White Americans are more likely to live in suburbs and small cities than their black counterparts.[72]
Population by state
- White American population distribution over time
-
 1790
1790 -
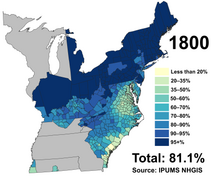 1800
1800 -
 1810
1810 -
 1820
1820 -
 1830
1830 -
 1840
1840 -
 1850
1850 -
 1860
1860 -
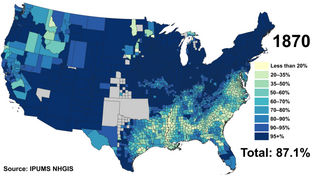 1870
1870 -
 1880
1880 -
 1890
1890 -
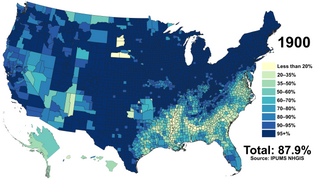 1900
1900 -
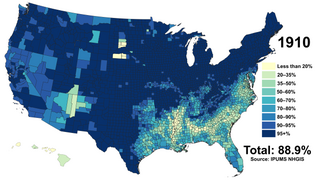 1910
1910 -
 1920
1920 -
 1940
1940 -
 1950
1950 -
 1960
1960 -
 1970
1970 -
 1980
1980 -
 1990
1990 -
 2000
2000 -
 2010
2010 -
 2020
2020


White Americans of one race or alone from 2000 to 2020
| State | 2000 | 2010 | 2020 | Growth | |||
|---|---|---|---|---|---|---|---|
| Pop. 2000 | % 2000 | Pop. 2010 | % 2010 | Pop. 2020 | % 2020 | % growth between 2000 and 2010 | |
| 3,162,808 | 71.1% | 3,275,394 | 68.5% | 3,220,452 | 64.1% | +3.6% | |
| 434,534 | 69.3% | 473,576 | 66.7% | 435,392 | 59.4% | +9.0% | |
| 3,873,611 | 75.5% | 4,667,121 | 73.0% | 4,322,337 | 60.4% | +20.5% | |
| 2,138,598 | 80.0% | 2,245,229 | 77.0% | 2,114,512 | 70.2% | +5.0% | |
| 20,170,059 | 59.5% | 21,453,934 | 57.6% | 16,296,122 | 41.2% | +6.4% | |
| 3,560,005 | 82.8% | 4,089,202 | 81.3% | 4,082,927 | 70.7% | +14.9% | |
| 2,780,355 | 81.6% | 2,772,410 | 77.6% | 2,395,128 | 66.4% | -0.3% | |
| 584,773 | 74.6% | 618,617 | 68.9% | 597,763 | 60.4% | +5.8% | |
| 176,101 | 30.8% | 231,471 | 38.5% | 273,194 | 39.4% | +31.4% | |
| 12,465,029 | 78.0% | 14,109,162 | 75.0% | 12,422,961 | 57.7% | +13.2% | |
| 5,327,281 | 65.1% | 5,787,440 | 59.7% | 5,555,483 | 51.9% | +8.6% | |
| 294,102 | 24.3% | 336,599 | 24.7% | 333,261 | 22.9% | +14.4% | |
| 1,177,304 | 91.0% | 1,396,487 | 89.1% | 1,510,360 | 82.1% | +18.6% | |
| 9,125,471 | 73.5% | 9,177,877 | 71.5% | 7,868,227 | 61.4% | +0.6% | |
| 5,320,022 | 87.5% | 5,467,906 | 84.3% | 5,241,791 | 77.2% | +2.8% | |
| 2,748,640 | 93.9% | 2,781,561 | 91.3% | 2,694,521 | 84.5% | +1.2% | |
| 2,313,944 | 86.1% | 2,391,044 | 83.8% | 2,222,462 | 75.6% | +3.3% | |
| 3,640,889 | 90.1% | 3,809,537 | 87.8% | 3,711,254 | 82.4% | +4.6% | |
| 2,856,161 | 63.9% | 2,836,192 | 62.6% | 2,675,652 | 57.1% | -0.7% | |
| 1,236,014 | 96.9% | 1,264,971 | 95.2% | 1,237,041 | 90.8% | +2.3% | |
| 3,391,308 | 64.0% | 3,359,284 | 58.2% | 3,007,874 | 48.7% | -0.9% | |
| 5,367,286 | 84.5% | 5,265,236 | 80.4% | 4,896,037 | 69.6% | -1.9% | |
| 7,966,053 | 80.2% | 7,803,120 | 78.9% | 7,444,974 | 73.9% | -2.0% | |
| 4,400,282 | 89.4% | 4,524,062 | 85.3% | 4,423,146 | 77.5% | +2.8% | |
| 1,746,099 | 61.4% | 1,754,684 | 59.1% | 1,658,893 | 56% | +0.5% | |
| 4,748,083 | 84.9% | 4,958,770 | 82.8% | 4,740,335 | 77% | +4.4% | |
| 817,229 | 90.6% | 884,961 | 89.4% | 916,524 | 84.5% | +8.3% | |
| 1,533,261 | 89.6% | 1,572,838 | 86.1% | 1,538,052 | 78.4% | +2.6% | |
| 1,501,886 | 75.2% | 1,786,688 | 66.2% | 1,588,463 | 51.2% | +19.0% | |
| 1,186,851 | 96.0% | 1,236,050 | 92.3% | 1,216,203 | 88.3% | +4.1% | |
| 6,104,705 | 72.6% | 6,029,248 | 68.6% | 5,112,280 | 55% | -1.2% | |
| 1,214,253 | 66.8% | 1,407,876 | 68.4% | 1,078,927 | 51% | +15.9% | |
| 12,893,689 | 67.9% | 12,740,974 | 65.7% | 11,143,349 | 55.2% | -1.2% | |
| 5,804,656 | 72.1% | 6,528,950 | 68.5% | 6,448,459 | 62.2% | +12.5% | |
| 593,181 | 92.4% | 605,449 | 90.0% | 645,938 | 82.9% | +2.1% | |
| 9,645,453 | 85.0% | 9,539,437 | 82.7% | 9,080,688 | 77% | -1.1% | |
| 2,628,434 | 76.2% | 2,706,845 | 72.2% | 2,514,884 | 63.5% | +3.0% | |
| 2,961,623 | 86.6% | 3,204,614 | 83.6% | 3,169,096 | 74.8% | +8.2% | |
| 10,484,203 | 85.4% | 10,406,288 | 81.9% | 9,750,687 | 75% | -0.7% | |
| 891,191 | 85.0% | 856,869 | 81.4% | 782,920 | 71.3% | -3.8% | |
| 2,695,560 | 67.2% | 3,060,000 | 66.2% | 3,243,442 | 63.4% | +13.5% | |
| 669,404 | 88.7% | 699,392 | 85.9% | 715,336 | 80.7% | +4.5% | |
| 4,563,310 | 80.2% | 4,921,948 | 77.6% | 4,990,938 | 72.2% | +7.9% | |
| 14,799,505 | 71.0% | 17,701,552 | 70.4% | 14,609,365 | 50.1% | +19.6% | |
| 1,992,975 | 89.2% | 2,379,560 | 86.1% | 2,573,413 | 78.7% | +19.4% | |
| 589,208 | 96.8% | 596,292 | 95.3% | 577,751 | 89.8% | +1.2% | |
| 5,120,110 | 72.3% | 5,486,852 | 68.6% | 5,208,856 | 60.3% | +7.2% | |
| 4,821,823 | 81.8% | 5,196,362 | 77.3% | 5,130,920 | 66.6% | +7.8% | |
| 1,718,777 | 95.0% | 1,739,988 | 93.9% | 1,610,749 | 89.8% | +1.2% | |
| 4,769,857 | 88.9% | 4,902,067 | 86.2% | 4,737,545 | 80.4% | +2.8% | |
| 454,670 | 92.1% | 511,279 | 90.7% | 488,374 | 84.7% | +12.4% | |
| 211,460,626 | 75.1% | 223,553,265 | 72.4% | 204,277,273 | 61.6% | +5.7% | |
| State | Pop. 2016 | % 2016 | Pop. 2017 | % 2017 | percentage growth |
numeric growth |
|---|---|---|---|---|---|---|
| 3,371,066 | 69.35% | 3,374,131 | 69.22% | -0.13% | +3,065 | |
| 490,864 | 66.20% | 486,724 | 65.79% | -0.41% | -4,140 | |
| 5,753,506 | 83.28% | 5,827,866 | 83.06% | -0.22% | +74,360 | |
| 2,372,843 | 79.41% | 2,381,662 | 79.27% | -0.14% | +3,740 | |
| 28,560,032 | 72.68% | 28,611,160 | 72.37% | -0.31% | +51,128 | |
| 4,837,197 | 87.47% | 4,894,372 | 87.29% | -0.18% | +57,175 | |
| 2,891,943 | 80.60% | 2,879,759 | 80.26% | -0.34% | -12,184 | |
| 667,076 | 70.02% | 670,512 | 69.70% | -0.32% | +3,436 | |
| 305,232 | 44.60% | 313,234 | 45.14% | +0.54% | +8,002 | |
| 16,022,497 | 77.56% | 16,247,613 | 77.43% | -0.13% | +225,116 | |
| 6,310,426 | 61.18% | 6,341,768 | 60.81% | -0.37% | +31,342 | |
| 370,362 | 25.92% | 366,546 | 25.67% | -0.25% | -3,816 | |
| 1,567,868 | 93.32% | 1,599,814 | 93.18% | -0.2% | +31,946 | |
| 9,909,184 | 77.20% | 9,864,942 | 77.06% | -0.14% | -44,242 | |
| 5,679,252 | 85.61% | 5,690,929 | 85.36% | -0.25% | +11,677 | |
| 2,860,136 | 91.35% | 2,864,664 | 91.06% | -0.29% | +4,528 | |
| 2,519,340 | 86.64% | 2,519,176 | 86.47% | -0.17% | -164 | |
| 3,901,878 | 87.96% | 3,908,964 | 87.76% | -0.20% | +7,086 | |
| 2,958,471 | 63.13% | 2,951,003 | 63.00% | -0.13% | -7,468 | |
| 1,261,247 | 94.81% | 1,264,744 | 94.67% | -0.14% | +3,497 | |
| 3,572,673 | 59.30% | 3,568,679 | 58.96% | -0.34% | -3,994 | |
| 5,575,622 | 81.71% | 5,576,725 | 81.29% | -0.42% | +1,103 | |
| 7,906,913 | 79.60% | 7,914,418 | 79.44% | -0.16% | +7,505 | |
| 4,687,397 | 84.84% | 4,708,215 | 84.43% | -0.41% | +20,818 | |
| 1,771,276 | 59.33% | 1,766,950 | 59.21% | -0.12% | -4,326 | |
| 5,069,869 | 83.23% | 5,080,444 | 83.10% | -0.13% | +10,575 | |
| 926,475 | 89.20% | 935,792 | 89.08% | -0.12% | +9,317 | |
| 1,693,622 | 88.78% | 1,700,881 | 88.58% | -0.20% | +7,259 | |
| 2,208,915 | 75.15% | 2,235,657 | 74.57% | -0.58% | +26,742 | |
| 1,251,836 | 93.77% | 1,256,807 | 93.59% | -0.18% | +4,971 | |
| 6,499,057 | 72.38% | 6,489,409 | 72.06% | -0.32% | -9,648 | |
| 1,716,662 | 82.31% | 1,715,623 | 82.16% | -0.15% | -1,039 | |
| 13,856,651 | 69.85% | 13,807,127 | 69.56% | -0.29% | -49,524 | |
| 7,212,423 | 71.01% | 7,276,995 | 70.83% | -0.18% | +64,572 | |
| 663,424 | 87.81% | 661,217 | 87.53% | -0.28% | -2,207 | |
| 9,578,424 | 82.41% | 9,579,207 | 82.16% | -0.25% | +783 | |
| 2,923,751 | 74.56% | 2,921,390 | 74.32% | -0.24% | -2,361 | |
| 3,569,538 | 87.29% | 3,607,515 | 87.08% | -0.21% | +37,977 | |
| 10,525,562 | 82.31% | 10,507,780 | 82.06% | -0.25% | -17,782 | |
| 892,287 | 84.37% | 890,883 | 84.07% | -0.30% | -1,404 | |
| 3,393,346 | 68.2% | 3,440,141 | 68.47% | +0.27% | +46,795 | |
| 733,199 | 85.10% | 738,554 | 84.92% | -0.18% | +5,355 | |
| 5,231,987 | 78.68% | 5,276,748 | 78.57% | -0.11% | +44,761 | |
| 22,166,782 | 79.44% | 22,404,118 | 79.15% | -0.29% | +237,336 | |
| 2,774,606 | 91.14% | 2,820,387 | 90.93% | -0.21% | +45,781 | |
| 589,836 | 94.62% | 589,163 | 94.47% | -0.15% | -673 | |
| 5,891,174 | 70.01% | 5,904,472 | 69.71% | -0.30% | +13,298 | |
| 5,820,007 | 79.93% | 5,887,060 | 79.49% | -0.44% | +67,053 | |
| 1,712,647 | 93.66% | 1,699,266 | 93.58% | -0.08% | -13,381 | |
| 5,049,698 | 87.47% | 5,060,891 | 87.32% | -0.15% | +11,193 | |
| 543,224 | 92.87% | 537,396 | 92.76% | -0.11% | -5,828 | |
| 248,619,303 | 76.87% | 249,619,493 | 76.64% | -0.23% | +1,000,190 |
Non-Hispanic population
| State | Pop. 2016 | % 2016 | Pop. 2017 | % 2017 | percentage growth |
numeric growth |
|---|---|---|---|---|---|---|
| 3,198,381 | 65.80% | 3,196,852 | 65.58% | -0.22% | -1,529 | |
| 454,651 | 61.31% | 449,776 | 60.80% | -0.51% | -4,875 | |
| 3,819,881 | 55.29% | 3,849,130 | 54.86% | -0.43% | +29,249 | |
| 2,175,521 | 72.80% | 2,177,809 | 72.49% | -0.31% | +2,288 | |
| 14,797,971 | 37.66% | 14,696,754 | 37.17% | -0.49% | -101,217 | |
| 3,791,612 | 68.56% | 3,827,750 | 68.26% | -0.30% | +36,135 | |
| 2,428,332 | 67.68% | 2,404,792 | 67.02% | -0.66% | -23,540 | |
| 597,728 | 62.74% | 599,260 | 62.30% | -0.44% | +1,532 | |
| 249,141 | 36.40% | 255,387 | 36.80% | +0.40% | +6,246 | |
| 11,273,388 | 54.57% | 11,343,977 | 54.06% | -0.51% | +70,589 | |
| 5,499,055 | 53.32% | 5,507,334 | 52.81% | -0.51% | +8,279 | |
| 317,026 | 22.19% | 312,492 | 21.89% | -0.30% | -4,534 | |
| 1,382,934 | 82.32% | 1,408,294 | 82.02% | -0.30% | +25,360 | |
| 7,915,013 | 61.65% | 7,849,887 | 61.32% | -0.33% | -65,126 | |
| 5,280,029 | 79.59% | 5,280,420 | 79.20% | -0.39% | +391 | |
| 2,696,686 | 86.13% | 2,695,962 | 85.70% | -0.43% | -724 | |
| 2,215,920 | 76.21% | 2,209,748 | 75.86% | -0.35% | -6,172 | |
| 3,767,092 | 84.92% | 3,768,891 | 84.61% | -0.31% | +1,799 | |
| 2,760,416 | 58.91% | 2,747,730 | 58.66% | -0.25% | -12,686 | |
| 1,243,741 | 93.50% | 1,246,478 | 93.30% | -0.20% | +2,737 | |
| 3,098,543 | 51.43% | 3,077,907 | 50.86% | -0.57% | -20,636 | |
| 4,972,010 | 72.86% | 4,953,695 | 72.21% | -0.65% | -18,315 | |
| 7,489,609 | 75.40% | 7,488,326 | 75.17% | -0.23% | -1,283 | |
| 4,442,684 | 80.41% | 4,455,605 | 79.89% | -0.52% | +12,921 | |
| 1,697,562 | 56.86% | 1,691,566 | 56.69% | -0.17% | -5,996 | |
| 4,855,156 | 79.71% | 4,859,227 | 79.48% | -0.23% | +4,071 | |
| 897,790 | 86.44% | 905,811 | 86.23% | -0.21% | +8,021 | |
| 1,515,494 | 79.44% | 1,516,962 | 79.00% | -0.44% | +1,468 | |
| 1,465,888 | 49.87% | 1,470,855 | 49.06% | -0.81% | +4,967 | |
| 1,212,377 | 90.81% | 1,215,447 | 90.52% | -0.29% | +3,070 | |
| 5,002,866 | 55.72% | 4,962,470 | 55.10% | -0.62% | -40,396 | |
| 789,869 | 38.31% | 783,064 | 37.50% | -0.81% | -6,805 | |
| 11,047,456 | 55.69% | 10,972,959 | 55.28% | -0.41% | -74,497 | |
| 6,447,852 | 63.48% | 6,486,100 | 63.13% | -0.35% | +38,248 | |
| 641,945 | 84.96% | 639,029 | 84.59% | -0.37% | -2,916 | |
| 9,229,932 | 79.41% | 9,219,577 | 79.08% | -0.33% | -10,355 | |
| 2,592,571 | 66.12% | 2,581,568 | 65.67% | -0.45% | -11,003 | |
| 3,115,656 | 76.25% | 3,139,685 | 75.79% | -0.46% | +24,029 | |
| 9,841,619 | 76.96% | 9,796,510 | 76.50% | -0.44% | -45,109 | |
| 773,405 | 73.13% | 768,229 | 72.50% | -0.63% | -5,176 | |
| 3,165,176 | 63.82% | 3,203,045 | 63.75% | -0.07% | +37,869 | |
| 710,509 | 82.47% | 714,881 | 82.20% | -0.27% | +4,372 | |
| 4,931,609 | 74.17% | 4,963,780 | 73.91% | -0.26% | +32,171 | |
| 11,862,697 | 42.51% | 11,886,381 | 42.00% | -0.51% | +23,684 | |
| 2,400,885 | 78.86% | 2,434,785 | 78.49% | -0.37% | +33,900 | |
| 580,238 | 93.08% | 579,149 | 92.86% | -0.22% | -1,089 | |
| 5,247,231 | 62.36% | 5,241,262 | 61.88% | -0.48% | -5,969 | |
| 5,049,817 | 69.36% | 5,091,370 | 68.75% | -0.61% | +41,553 | |
| 1,688,472 | 92.33% | 1,674,557 | 92.22% | -0.11% | -13,915 | |
| 4,710,928 | 81.60% | 4,713,993 | 81.34% | -0.26% | +3,065 | |
| 492,235 | 84.16% | 486,565 | 83.99% | -0.17% | -5,670 | |
| 197,834,599 | 61.17% | 197,803,083 | 60.73% | -0.44% | -31,516 |
Politics
A majority of White Americans have voted for the Republican Party since the 1968 United States presidential election, with the 1964 United States presidential election being the last election when the Democratic Party won a majority of White voters.
In 2012, 88% of Romney voters were white while 56% of Obama voters were white.[76] In the 2008 presidential election, John McCain won 55% of white votes.[77] In the 2010 House election, Republicans won 60% of the white votes.[78]
Some academics and commentators have argued that Donald Trump's presidential election victory in 2016 is an example of "White backlash".[79][80][81]
| Year | Candidate of the plurality |
Political party |
% of White vote[citation needed] |
Result |
|---|---|---|---|---|
| 1980 | Ronald Reagan | Republican Party | 56% | Won |
| 1984 | Ronald Reagan | Republican | 66% | Won |
| 1988 | George H. W. Bush | Republican | 59% | Won |
| 1992 | George H. W. Bush | Republican | 40% | Lost |
| 1996 | Bob Dole | Republican | 46% | Lost |
| 2000 | George W. Bush | Republican | 55% | Won |
| 2004 | George W. Bush | Republican | 58% | Won |
| 2008 | John McCain | Republican | 55% | Lost |
| 2012 | Mitt Romney | Republican | 59% | Lost |
| 2016 | Donald Trump | Republican | 57% | Won |
| 2020 | Donald Trump | Republican | 58% | Lost |
Culture
From their earliest presence in
Albion's Seed: Four British Folkways in America

In his 1989 book Albion's Seed: Four British Folkways in America, David Hackett Fischer explores the details of the folkways of four groups of settlers from the British Isles that moved to the American colonies during the 17th and 18th centuries from distinct regions of Britain and Ireland. His thesis is that the culture of each group persisted (albeit in modified form), providing the basis for the modern United States.[84]
According to Fischer, the foundation of America's four regional cultures was formed from four mass migrations from four regions of the British Isles by four distinct ethno-cultural groups.
Then, between 1675 and 1725, thousands of Irish,
In his book, Fischer brings up several points. He states that the U.S. is not a country with one "general" culture and several "regional" cultures, as is commonly thought. Rather, there are only four regional cultures as described above, and understanding this helps one to more clearly understand American history as well as contemporary American life. Fischer asserts that it is not only important to understand where different groups came from, but when. All population groups have, at different times, their own unique set of beliefs, fears, hopes and prejudices. When different groups moved to America and brought certain beliefs and values with them, these ideas became, according to Fischer, more or less frozen in time, even if they eventually changed in their original place of origin.[89]
Admixture
Admixture in non-Hispanic whites
White Americans have a mean of 98.6% European, 0.19% sub-Saharan African, and 0.18% Native American ancestry.[90] However, non-European ancestry in White Americans is highly variable; for example, Black ancestry (2% or greater) is found in over five percent of European Americans in Louisiana and South Carolina, and Native American ancestry (2% or greater) is found in over three percent of European Americans in Louisiana and North Dakota. African ancestry is most common in the South and least common in the Midwest; Native American ancestry is more common in Western states than Eastern states.[91]
Older studies have also been performed. DNA analysis on White Americans by geneticist
In a 2007 study, Gonçalves et al. reported
Admixture in Hispanic whites
In contrast to
See also
- American ancestry
- Anglo
- Emigration from Europe
- European Americans
- Hyphenated American
- List of United States cities by percentage of white population
- Middle Eastern Americans
- Non-Hispanic or Latino whites
- Race and ethnicity in the United States
- Racism in the United States
- Stereotypes of white Americans
- White Anglo-Saxon Protestant
- White ethnic
- White Latino Americans
- White Puerto Ricans
- White Southerners
- White Americans in California
- White Americans in Maryland
- White Americans in Texas
- White supremacy
- White nationalism
Notes
References
- ^ "2020 Census Redistricting: Supplementary Tables". United States Census Bureau. August 12, 2021. Archived from the original on September 18, 2021. Retrieved September 6, 2021.
- ^ "Religious tradition by race/ethnicity (2014)". The Pew Forum on Religion & Public Life. Retrieved April 5, 2019.
- ^ "Search". QuickFacts. U.S. Census Bureau.
- ^ "2020 Census Illuminates Racial and Ethnic Composition of the Country". Census.gov. Retrieved April 15, 2023.
- ^ "Methodology for the United States Population Estimates: Vintage 2022" (PDF). US Census Bureau. December 2022. Retrieved April 15, 2023.
- ^ a b c "Analysis | There's a big problem with how the census measures race". The Washington Post. February 6, 2018. Retrieved July 23, 2021.
- ^ a b c Demby, Gene (June 16, 2014). "On The Census, Who Checks 'Hispanic,' Who Checks 'White,' And Why". NPR.org. Retrieved July 23, 2021.
- ^ a b c Karen R. Humes; Nicholas A. Jones; Roberto R. Ramirez, eds. (March 2011). "Definition of Race Categories Used in the 2010 Census" (PDF). United States Census Bureau. p. 3. Retrieved September 8, 2013.
- ^ a b "The White Population: 2000" (PDF). United States Census Bureau. August 2001. Retrieved March 10, 2011.
- ^ "Public Comments Received on Federal Register notice 79 FR 71377: Proposed Information Collection; Comment Request; 2015 National Content Test" (PDF). Census.gov. December 2, 2014 – February 2, 2015. Retrieved October 29, 2019.
- ^ "Census Bureau explores new Middle East/North Africa ethnic category". Pewresearch.org. March 24, 2014. Retrieved November 6, 2017.
- ^ Sources:
- ^ Sources:
- Thompson, Derek (August 19, 2008). "Do white people really come from the Caucasus?". Slate. Retrieved March 10, 2011.
Caucasians included most Europeans, Northern Africans, and Asians as far east as the Ganges Delta in modern India.
- Lee, Sandra Soo-Jin; Mountain, Joanna; Koenig, Barbara A. (2001). "The meanings of "race" in the new genomics: Implications for health disparities research" (PDF). Yale Journal of Health Policy, Law, and Ethics. 1: 33–75. PMID 12669320. Archived from the original(PDF) on March 3, 2016.
- Reynolds Farley, 'The New Census Question about Ancestry: What Did It Tell Us?', Demography, Vol. 28, No. 3 (August 1991), pp. 414, 421.
- Stanley Lieberson and Lawrence Santi, 'The Use of Nativity Data to Estimate Ethnic Characteristics and Patterns', Social Science Research, Vol. 14, No. 1 (1985), pp. 44–46.
- Thompson, Derek (August 19, 2008). "Do white people really come from the Caucasus?". Slate. Retrieved March 10, 2011.
- ^ S2CID 60711423.
- ^ "Race". QuickFacts. U.S. Census Bureau.
- PMID 9736867.
- ^ Baum 2006, p. 3, 18.
- ^ "U.S. Census website". United States Census Bureau. Retrieved August 29, 2017.
- ^ "Search". American FactFinder. U.S. Census Bureau. Archived from the original on February 11, 2020. Retrieved November 7, 2009.
- ^ Sharon R. Ennis; Ríos-Vargas Merarys; Nora G. Albert (May 2011). "U.S. Census Bureau" (PDF). p. 14. Retrieved July 11, 2011.
- ^ "Selected Social Characteristics in the United States: 2007". U.S. Census American Community Survey. 2007. Archived from the original on February 11, 2020. Retrieved October 5, 2020.
- ^ 2021 Community Survey, Table B03001: Hispanic or Latino Origin by Specific Origin
- ^ Sources:
- Pulera, Dominic (October 20, 2004). Sharing the Dream: White Males in Multicultural America. A&C Black. p. 57. ISBN 978-0-8264-1643-8. Retrieved October 22, 2016.
- Reynolds Farley, 'The New Census Question about Ancestry: What Did It Tell Us?', Demography, Vol. 28, No. 3 (August 1991), pp. 414, 421.
- Stanley Lieberson and Lawrence Santi, 'The Use of Nativity Data to Estimate Ethnic Characteristics and Patterns', Social Science Research, Vol. 14, No. 1 (1985), pp. 44–46.
- Pulera, Dominic (October 20, 2004). Sharing the Dream: White Males in Multicultural America. A&C Black. p. 57.
- ^ "Questions and Answers for Census 2000 Data on Race". Archived from the original on March 4, 2010. Retrieved April 25, 2010.
- ^ "American FactFinder Help". United States Census Bureau. Archived from the original on March 5, 2001. Retrieved November 11, 2008.
Origin can be viewed as the heritage, nationality group, lineage, or country of birth of the person or the person's parents or ancestors before their arrival in the United States. People who identify their origin as Spanish, Hispanic, or Latino may be of any race.
- ^ "Overview of Race and Hispanic Origin: 2000" (PDF). Census.gov. Retrieved October 22, 2016.
- ^ "T4-2008. Hispanic or Latino By Race". 2008 Population Estimates. U.S. Census Bureau. Retrieved March 15, 2010.
- ^ "B03002. HISPANIC OR LATINO ORIGIN BY RACE". 2008 American Community Survey 1-Year Estimates. U.S. Census Bureau. Retrieved March 16, 2010.
- ^ U.S. Bureau of the Census (1933). Population, Volume II: General Report, Statistics by Subjects (Report). Washington, DC: Government Printing Office. p. 27.
- ^ "Measuring Race and Ethnicity Across the Decades: 1790-2010, Mapped to 1997 U.S. Office of Management and Budget Classification Standards". The United States Census Bureau.
- ^ Bashi Treitler, Vilna Francine. "The Race Question". Rutgers University Faculty Webpages. Archived from the original on October 7, 2008.
- ^ "Public Comments Received on Federal Register notice 79 FR 71377: Proposed Information Collection; Comment Request; 2015 National Content Test" (PDF). Census.gov. December 2, 2014 – February 2, 2015. Retrieved October 29, 2019.
- ^ "Not Quite White: Race Classification and the Arab American Experience – Arab American Institute". Aaiusa.org. Archived from the original on May 27, 2020. Retrieved December 14, 2017.
- ^ "Lobbying for a 'MENA' category on U.S. Census". USA Today. August 13, 2014.
- ^ "Why Arab Americans are pushing for a 'Middle East or North African' category on the census". PBS. April 28, 2023.
- ^ "Surveillance Epidemiology and End Results. Race and Nationality Descriptions from the 2000 Census and Bureau of Vital Statistics" (PDF). Seer.cancer.gov. May 21, 2007. Retrieved October 22, 2016.
- ^ "Clark Library | U-M Library". Lib.umich.edu. Archived from the original on March 13, 2005. Retrieved June 5, 2023.
- ^ "Access Data: Public Use Microdata (PUMS): 2005 PUMS Code Lists: Ancestry Codes". Archived from the original on September 16, 2008. Retrieved August 22, 2008.
- S2CID 143001730.
- JSTOR 23885597.
- ISBN 978-0-618-08232-2.
- ^ Siporin, Steve (November 1990). "Immigrant and Ethnic Family Folklore". Western States Jewish History. 22 (3): 230–242.
- ^ Lerner, Michael (May 18, 1993). "Jews Are Not White". The Village Voice.
In America, to be 'white' means to be the beneficiary of the past 500 years of European exploration and exploitation of the rest of the world
- ^ Hilene Flanzbaum, ed. The Americanization of the Holocaust (1999)
- ^ Monty Noam Penkower, "Shaping Holocaust Memory," American Jewish History 2000 88(1): 127–132. 0164–0178
- ^ a b Armas Kustaa Ensio Holmio, "History of the Finns in Michigan", p. 17.
- ^ Franklin, Benjamin (1751). Observations concerning the increase of mankind, peopling of countries, &c. Tarrytown, N.Y., Reprinted, W. Abbatt. p. 224.
- .
- ^ Roediger, Wages of Whiteness, 186; Tony Horwitz, Confederates in the Attic: Dispatches from the Unfinished Civil War (New York, 1998).
- ISBN 0-939479-23-0.
- ^ "Official census statistics of the United States race and Hispanic origin population" (PDF). Census.gov. Archived from the original (PDF) on November 14, 2014.
- ^ "Census 2000 Summary File 1 (SF 1) 100-Percent Data Geographic Area: United States". Census.gov. Archived from the original on February 12, 2020. Retrieved April 5, 2009.
- ^ a b "The White Population: 2000" (PDF). Census.gov. Archived from the original (PDF) on June 25, 2005.
- ^ "Overview of Race and Hispanic Origin: 2010" (PDF). Census.gov. Archived from the original (PDF) on May 5, 2011.
- ^ Hixson, Lindsay; Bradford B. Hepler; Myoung Ouk Kim (September 2011). "The White Population: 2010" (PDF). United States Census Bureau. United States Department of Commerce. Retrieved November 20, 2012.
- ^ Grieco, Elizabeth M.; Acosta, Yesenia D.; de la Cruz, G. Patricia; Gambino, Christine; Gryn, Thomas; Larsen, Luke J.; Trevelyan, Edward N.; Walters, Nathan P. (May 2012). "The Foreign-Born Population in the United States: 2010" (PDF). Census.gov. United States Census Bureau. Archived from the original (PDF) on May 11, 2012.
- ^ "Over Half of White Population Reported Being English, German or Irish".
- ^ "United States Population Projections By Race and Hispanic Origin: 2000 TO 2050" (PDF). United States Census Bureau. Archived from the original (Excel) on March 6, 2008. Retrieved May 5, 2008.
- ^ "Ancestry of the Population by State: 1980 – Table 3" (PDF). Census.gov. Retrieved October 22, 2016.
- ISBN 978-0-19-503794-4.
- ^ Chokshi, Niraj (June 30, 2014). "Diversity in America's counties, in 5 maps". The Washington Post. Washington, D.C. Retrieved October 26, 2019.
- ^ Brewer, Cynthia; Suchan, Trudy (2001). Census 2000, The Geography of US Diversity. Redlands, California: ESRI Press.
- ^ "Distribution of those identifying as White alone, by state, US Census Bureau". Archived from the original on May 5, 2007. Retrieved October 5, 2006.
- ^ "United States – States; and Puerto Rico: Percent of the Total Population Who Are White Alone 2007". Census.gov. Archived from the original on July 17, 2009. Retrieved January 5, 2009.
- ^ "GCT0209. Percent of the Total Population Who Are White Alone, Not Hispanic or Latino". American FactFinder. U.S. Census Bureau. Archived from the original on November 20, 2011. Retrieved January 16, 2011.
- ^ "New Study Claims US Jews Have Reasons to Be Proud". Israelnationalnews.com. June 25, 2008. Retrieved October 22, 2016.
- ^ "Cuba Fact Sheet Final Draft 08252006 _3_.doc" (PDF). Pewhispanic.org. Archived from the original (PDF) on May 30, 2009. Retrieved October 22, 2016.
- ^ "Income, Poverty, and Health Insurance Coverage in the United States: 2004" (PDF). Census.gov. Retrieved October 22, 2016.
- ^ "Rural Poverty: Myths and Realities". Archived from the original on July 4, 2007. Retrieved June 5, 2007.
- ^ "US Census Bureau report on educational attainment in the United States, 2003" (PDF). Retrieved December 23, 2006.
- ^ "US Census Bureau, Personal income forum, Age 25+, 2005". Archived from the original on January 4, 2007. Retrieved January 20, 2007.
- S2CID 55740758.
- ^ "American FactFinder". August 31, 2004. Archived from the original on August 31, 2004. Retrieved June 28, 2022.
- ^ "Race and Ethnicity in the United States: 2010 Census and 2020 Census". Census.gov. Retrieved June 28, 2022.
- ^ a b "Annual Estimates of the Resident Population by Sex, Race, and Hispanic Origin for the United States, States, and Counties: April 1, 2010 to July 1, 2017: 2017 Population Estimates". American FactFinder. Archived from the original on August 19, 2018. Retrieved August 29, 2017.
- ^ Tom Scocca, "Eighty-Eight Percent of Romney Voters Were White", Slate November 7, 2012 Archived July 6, 2015, at the Wayback Machine
- ^ "Dissecting the 2008 Electorate: Most Diverse in U.S. History" Archived June 18, 2012, at the Wayback Machine. Pew Research Center. April 30, 2009.
- ^ "The Latino Vote in the 2010 Elections". Pew Research Center. November 3, 2010. Archived from the original on February 5, 2011. Retrieved January 30, 2011.
- ^ II, Vann R. Newkirk (January 15, 2018). "Five Decades of White Backlash". The Atlantic. Retrieved February 16, 2018.
- ^ Blake, John (January 8, 2018). "How Trump became 'the white affirmative action president'". CNN. Video by Tawanda Scott Sambou. Retrieved February 16, 2018.
- S2CID 204870213.
Deindustrialization in the US, and the associated localized deterioration in employment, wages, and communities, appear central to the white voter backlash that culminated in the election of Donald Trump.
- ^ "European Influences on Colonial American Culture". pbslearningmedia.org.
- ISBN 978-1-61069-164-2. Retrieved October 22, 2016.
- ^ David Hackett Fischer, Albion's Seed (Oxford University Press, 1989), p. 6
- ^ Fischer, Albion's Seed, pp. 13–206
- ^ Fischer, Albion's Seed pp. 207–418
- ^ Fischer, Albion's Seed, pp. 419–604
- ^ Fischer, Albion's Seed, pp. 605–782
- ^ Hackett Fischer, David. Albion's Seed Oxford University Press, 1989.
- PMID 25529636.
- ^ Bryc 2015: Figure 3
- S2CID 7877572.
- UPI.
- ^ Jim Wooten, "Race Reversal Man Lives as 'Black' for 50 Years — Then Finds Out He's Probably Not, ABC News (2004).
- PMID 17573655.
- PMID 12671003.
- . p. 42. September 18, 2014. Retrieved July 16, 2015.
- ^ Zimmer, Carl (December 24, 2014). "White? Black? A Murky Distinction Grows Still Murkie". The New York Times. Retrieved October 24, 2015.
External links
- White Population 2000 from the US Census