Wind

Wind is the natural movement of
Winds are commonly classified by their
In
In human civilization, the concept of wind has been explored in
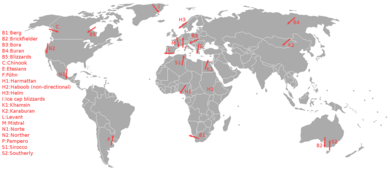
Winds can shape landforms, via a variety of aeolian processes such as the formation of fertile soils, for example loess, and by erosion. Dust from large deserts can be moved great distances from its source region by the prevailing winds; winds that are accelerated by rough topography and associated with dust outbreaks have been assigned regional names in various parts of the world because of their significant effects on those regions. Wind also affects the spread of wildfires. Winds can disperse seeds from various plants, enabling the survival and dispersal of those plant species, as well as flying insect and bird populations. When combined with cold temperatures, the wind has a negative impact on livestock. Wind affects animals' food stores, as well as their hunting and defensive strategies.
Causes
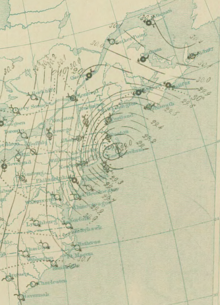
Wind is caused by differences in atmospheric pressure, which are mainly due to temperature differences. When a
Winds defined by an equilibrium of physical forces are used in the decomposition and analysis of wind profiles. They are useful for simplifying the atmospheric
Measurement

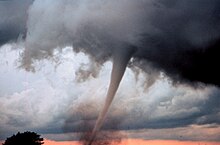
Wind direction is usually expressed in terms of the direction from which it originates. For example, a northerly wind blows from the north to the south.[7] Weather vanes pivot to indicate the direction of the wind.[8] At airports, windsocks indicate wind direction, and can also be used to estimate wind speed by the angle of hang.[9] Wind speed is measured by anemometers, most commonly using rotating cups or propellers. When a high measurement frequency is needed (such as in research applications), wind can be measured by the propagation speed of ultrasound signals or by the effect of ventilation on the resistance of a heated wire.[10] Another type of anemometer uses pitot tubes that take advantage of the pressure differential between an inner tube and an outer tube that is exposed to the wind to determine the dynamic pressure, which is then used to compute the wind speed.[11]
Sustained wind speeds are reported globally at a 10 meters (33 ft) height and are averaged over a 10‑minute time frame. The United States reports winds over a 1‑minute average for tropical cyclones,[12] and a 2‑minute average within weather observations.[13] India typically reports winds over a 3‑minute average.[14] Knowing the wind sampling average is important, as the value of a one-minute sustained wind is typically 14% greater than a ten-minute sustained wind.[15] A short burst of high speed wind is termed a wind gust, one technical definition of a wind gust is: the maxima that exceed the lowest wind speed measured during a ten-minute time interval by 10 knots (5 m/s) for periods of seconds. A squall is an increase of the wind speed above a certain threshold, which lasts for a minute or more.
To determine winds aloft,
Models
Models can provide spatial and temporal information about airflow. Spatial information can be obtained through the interpolation of data from various measurement stations, allowing for horizontal data calculation. Alternatively, profiles, such as the logarithmic wind profile, can be utilized to derive vertical information.
Temporal information is typically computed by solving the Navier-Stokes equations within numerical weather prediction models, generating global data for General Circulation Models or specific regional data. The calculation of wind fields is influenced by factors such as radiation differentials, Earth's rotation, and friction, among others.[18] Solving the Navier-Stokes equations is a time-consuming numerical process, but machine learning techniques can help expedite computation time.[19]
Numerical weather prediction models have significantly advanced our understanding of atmospheric dynamics and have become indispensable tools in weather forecasting and climate research. By leveraging both spatial and temporal data, these models enable scientists to analyze and predict global and regional wind patterns, contributing to our comprehension of the Earth's complex atmospheric system.
Wind force scale
Historically, the Beaufort wind force scale (created by Beaufort) provides an empirical description of wind speed based on observed sea conditions. Originally it was a 13-level scale (0-12), but during the 1940s, the scale was expanded to 18 levels (0-17).[20] There are general terms that differentiate winds of different average speeds such as a breeze, a gale, a storm, or a hurricane. Within the Beaufort scale, gale-force winds lie between 28 knots (52 km/h) and 55 knots (102 km/h) with preceding adjectives such as moderate, fresh, strong, and whole used to differentiate the wind's strength within the gale category.[21] A storm has winds of 56 knots (104 km/h) to 63 knots (117 km/h).[22] The terminology for tropical cyclones differs from one region to another globally. Most ocean basins use the average wind speed to determine the tropical cyclone's category. Below is a summary of the classifications used by Regional Specialized Meteorological Centers worldwide:
| General wind classifications | Tropical cyclone classifications (all winds are 10-minute averages) | ||||||||
|---|---|---|---|---|---|---|---|---|---|
| Beaufort scale[20] | 10-minute sustained winds | General term[23] | N Indian Ocean IMD
|
SW Indian Ocean MF |
Australian region South Pacific MSNZ
|
NW Pacific JMA |
NW Pacific JTWC |
NE Pacific & N Atlantic NHC & CPHC | |
| (knots) | (km/h) | ||||||||
| 0 | <1 | <2 | Calm | Low Pressure Area | Tropical disturbance | Tropical low Tropical Depression |
Tropical depression | Tropical depression | Tropical depression |
| 1 | 1–3 | 2–6 | Light air | ||||||
| 2 | 4–6 | 7–11 | Light breeze | ||||||
| 3 | 7–10 | 13–19 | Gentle breeze | ||||||
| 4 | 11–16 | 20–30 | Moderate breeze | ||||||
| 5 | 17–21 | 31–39 | Fresh breeze | Depression | |||||
| 6 | 22–27 | 41–50 | Strong breeze | ||||||
| 7 | 28–29 | 52–54 | Moderate gale | Deep depression | Tropical depression | ||||
| 30–33 | 56–61 | ||||||||
| 8 | 34–40 | 63–74 | Fresh gale | Cyclonic storm | Moderate tropical storm | Tropical cyclone (1) | Tropical storm | Tropical storm | Tropical storm |
| 9 | 41–47 | 76–87 | Strong gale | ||||||
| 10 | 48–55 | 89–102 | Whole gale | Severe cyclonic storm | Severe tropical storm | Tropical cyclone (2) | Severe tropical storm | ||
| 11 | 56–63 | 104–117 | Storm | ||||||
| 12 | 64–72 | 119–133 | Hurricane | Very severe cyclonic storm | Tropical cyclone | Severe tropical cyclone (3) | Typhoon | Typhoon | Hurricane (1) |
| 13 | 73–85 | 135–157 | Hurricane (2) | ||||||
| 14 | 86–89 | 159–165 | Severe tropical cyclone (4) | Major hurricane (3) | |||||
| 15 | 90–99 | 167–183 | Intense tropical cyclone | ||||||
| 16 | 100–106 | 185–196 | Major hurricane (4) | ||||||
| 17 | 107–114 | 198–211 | Severe tropical cyclone (5) | ||||||
| 115–119 | 213–220 | Very intense tropical cyclone | Super typhoon | ||||||
| >120 | >222 | Super cyclonic storm | Major hurricane (5) | ||||||
Enhanced Fujita scale
The
Station model
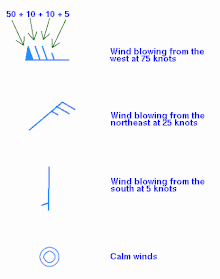
The station model plotted on surface weather maps uses a wind barb to show both wind direction and speed. The wind barb shows the speed using "flags" on the end.
- Each half of a flag depicts 5 knots (9.3 km/h) of wind.
- Each full flag depicts 10 knots (19 km/h) of wind.
- Each pennant (filled triangle) depicts 50 knots (93 km/h) of wind.[25]
Winds are depicted as blowing from the direction the barb is facing. Therefore, a northeast wind will be depicted with a line extending from the cloud circle to the northeast, with flags indicating wind speed on the northeast end of this line.
Global climatology
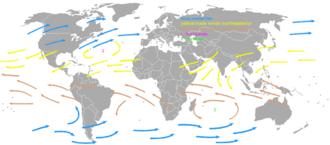

Easterly winds, on average, dominate the flow pattern across the poles, westerly winds blow across the
Directly under the subtropical ridge are the doldrums, or horse latitudes, where winds are lighter. Many of the Earth's deserts lie near the average latitude of the subtropical ridge, where descent reduces the
Tropics
The trade winds (also called trades) are the prevailing pattern of
A monsoon is a seasonal prevailing wind that lasts for several months within tropical regions. The term was first used in English in India, Bangladesh, Pakistan, and neighboring countries to refer to the big seasonal winds blowing from the Indian Ocean and Arabian Sea in the southwest bringing heavy rainfall to the area.[33] Its poleward progression is accelerated by the development of a heat low over the Asian, African, and North American continents during May through July, and over Australia in December.[34][35][36]
Westerlies and their impact

The Westerlies or the Prevailing Westerlies are the prevailing winds in the middle latitudes between 35 and 65 degrees latitude. These prevailing winds blow from the west to the east,[37][38] and steer extratropical cyclones in this general manner. The winds are predominantly from the southwest in the Northern Hemisphere and from the northwest in the Southern Hemisphere.[30] They are strongest in the winter when the pressure is lower over the poles, and weakest during the summer and when pressures are higher over the poles.[39]
Together with the
Polar easterlies
The polar easterlies, also known as Polar Hadley cells, are dry, cold prevailing winds that blow from the high-pressure areas of the
Local considerations
Sea and land breezes

In coastal regions, sea breezes and land breezes can be important factors in a location's prevailing winds. The sea is warmed by the sun more slowly because of water's greater
At night, the land cools off more quickly than the ocean because of differences in their specific heat values. This temperature change causes the daytime sea breeze to dissipate. When the temperature onshore cools below the temperature offshore, the pressure over the water will be lower than that of the land, establishing a land breeze, as long as an onshore wind is not strong enough to oppose it.[48]
Near mountains
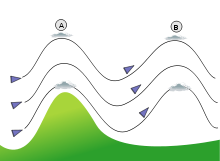
Over elevated surfaces, heating of the ground exceeds the heating of the surrounding air at the same altitude above
If there is a
In mountainous areas, local distortion of the airflow becomes severe. Jagged terrain combines to produce unpredictable flow patterns and turbulence, such as
Winds that flow over mountains down into lower elevations are known as downslope winds. These winds are warm and dry. In Europe downwind of the
Shear
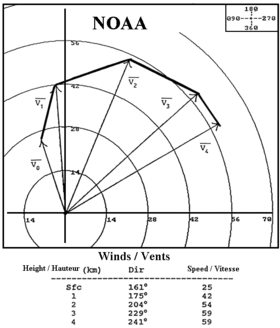
Wind shear, sometimes referred to as
Wind shear itself is a
Sound movement through the atmosphere is affected by wind shear, which can bend the wave front, causing sounds to be heard where they normally would not, or vice versa.[70] Strong vertical wind shear within the troposphere also inhibits tropical cyclone development,[71] but helps to organize individual thunderstorms into living longer life cycles that can then produce severe weather.[72] The thermal wind concept explains how differences in wind speed with height are dependent on horizontal temperature differences, and explains the existence of the jet stream.[73]
In civilization
Religion
As a natural force, the wind was often personified as one or more
History
Transportation
There are many different forms of sailing ships, but they all have certain basic things in common. Except for
For
Power source
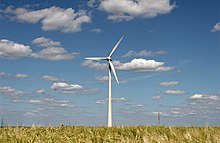
The ancient Sinhalese of Anuradhapura and in other cities around Sri Lanka used the monsoon winds to power furnaces as early as 300 BCE. The furnaces were constructed on the path of the monsoon winds to bring the temperatures inside up to 1,200 °C (2,190 °F).[93] A rudimentary windmill was used to power an organ in the first century CE.[94] Windmills were later built in Sistan, Afghanistan, from the 7th century CE. These were vertical-axle windmills,[95] with sails covered in reed matting or cloth material. These windmills were used to grind corn and draw up water, and were used in the gristmilling and sugarcane industries.[96] Horizontal-axle windmills were later used extensively in Northwestern Europe to grind flour beginning in the 1180s, and many Dutch windmills still exist.
Wind power is now one of the main sources of renewable energy, and its use is growing rapidly, driven by innovation and falling prices.[97] Most of the installed capacity in wind power is onshore, but offshore wind power offers a large potential as wind speeds are typically higher and more constant away from the coast.[98] Wind energy the kinetic energy of the air, is proportional to the third power of wind velocity. Betz's law described the theoretical upper limit of what fraction of this energy wind turbines can extract, which is about 59%.[99]
Recreation

Wind figures prominently in several popular sports, including recreational
In the natural world
In arid climates, the main source of erosion is wind.[102] The general wind circulation moves small particulates such as dust across wide oceans thousands of kilometers downwind of their point of origin,[103] which is known as deflation. Westerly winds in the mid-latitudes of the planet drive the movement of ocean currents from west to east across the world's oceans. Wind has a very important role in aiding plants and other immobile organisms in dispersal of seeds, spores, pollen, etc. Although wind is not the primary form of seed dispersal in plants, it provides dispersal for a large percentage of the biomass of land plants.
Erosion

Erosion can be the result of material movement by the wind. There are two main effects. First, wind causes small particles to be lifted and therefore moved to another region. This is called deflation. Second, these suspended particles may impact on solid objects causing erosion by abrasion (ecological succession). Wind erosion generally occurs in areas with little or no vegetation, often in areas where there is insufficient rainfall to support vegetation. An example is the formation of sand
Desert dust migration
During mid-summer (July in the northern hemisphere), the westward-moving trade winds south of the northward-moving subtropical ridge expand northwestward from the Caribbean into southeastern North America. When dust from the
There are local names for winds associated with sand and dust storms. The
Effect on plants

Wind dispersal of seeds, or
Wind also limits tree growth. On coasts and isolated mountains, the tree line is often much lower than in corresponding altitudes inland and in larger, more complex mountain systems, because strong winds reduce tree growth. High winds scour away thin
Wind can also cause plants damage through sand abrasion. Strong winds will pick up loose sand and topsoil and hurl it through the air at speeds ranging from 25 miles per hour (40 km/h) to 40 miles per hour (64 km/h). Such windblown sand causes extensive damage to plant seedlings because it ruptures plant cells, making them vulnerable to evaporation and drought. Using a mechanical sandblaster in a laboratory setting, scientists affiliated with the Agricultural Research Service studied the effects of windblown sand abrasion on cotton seedlings. The study showed that the seedlings responded to the damage created by the windblown sand abrasion by shifting energy from stem and root growth to the growth and repair of the damaged stems.[124] After a period of four weeks, the growth of the seedling once again became uniform throughout the plant, as it was before the windblown sand abrasion occurred.[125]
Besides plant gametes (seeds) wind also helps plants' enemies:
Effect on animals
Related damage

High winds are known to cause damage, depending upon the magnitude of their velocity and pressure differential. Wind pressures are positive on the windward side of a structure and negative on the leeward side. Infrequent wind gusts can cause poorly designed suspension bridges to sway. When wind gusts are at a similar frequency to the swaying of the bridge, the bridge can be destroyed more easily, such as what occurred with the Tacoma Narrows Bridge in 1940.[140] Wind speeds as low as 23 knots (43 km/h) can lead to power outages due to tree branches disrupting the flow of energy through power lines.[141] While no species of tree is guaranteed to stand up to hurricane-force winds, those with shallow roots are more prone to uproot, and brittle trees such as eucalyptus, sea hibiscus, and avocado are more prone to damage.[142] Hurricane-force winds cause substantial damage to mobile homes, and begin to structurally damage homes with foundations. Winds of this strength due to downsloped winds off terrain have been known to shatter windows and sandblast paint from cars.[59] Once winds exceed 135 knots (250 km/h), homes completely collapse, and significant damage is done to larger buildings. Total destruction to artificial structures occurs when winds reach 175 knots (324 km/h). The Saffir–Simpson scale and Enhanced Fujita scale were designed to help estimate wind speed from the damage caused by high winds related to tropical cyclones and tornadoes, and vice versa.[143][144]
Australia's
Wildfire intensity increases during daytime hours. For example, burn rates of
In outer space
The solar wind is quite different from a terrestrial wind, in that its origin is the Sun, and it is composed of charged particles that have escaped the Sun's atmosphere. Similar to the solar wind, the
The fastest wind ever recorded came from the
Planetary wind

The hydrodynamic wind within the upper portion of a planet's atmosphere allows light chemical elements such as
Solar wind
Rather than air, the solar wind is a
On other planets
Strong 300 kilometers per hour (190 mph) winds at Venus's cloud tops circle the planet every four to five Earth days.
See also
References
- ^ JetStream (2008). "Origin of Wind". National Weather Service Southern Region Headquarters. Archived from the original on 2009-03-24. Retrieved 2009-02-16.
- doi:10.5194/acp-13-1039-2013. Retrieved 2013-02-01.)
{{cite journal}}: CS1 maint: multiple names: authors list (link - ^ Glossary of Meteorology (2009). "Geostrophic wind". American Meteorological Society. Archived from the original on 2007-10-16. Retrieved 2009-03-18.
- ^ Glossary of Meteorology (2009). "Thermal wind". American Meteorological Society. Archived from the original on 2011-07-17. Retrieved 2009-03-18.
- ^ Glossary of Meteorology (2009). "Ageostrophic wind". American Meteorological Society. Archived from the original on 2011-09-17. Retrieved 2009-03-18.
- ^ Glossary of Meteorology (2009). "Gradient wind". American Meteorological Society. Archived from the original on 2008-05-28. Retrieved 2009-03-18.
- ^ JetStream (2008). "How to read weather maps". National Weather Service. Archived from the original on 2012-07-05. Retrieved 2009-05-16.
- ^ Glossary of Meteorology (2009). "Wind vane". American Meteorological Society. Archived from the original on 2007-10-18. Retrieved 2009-03-17.
- ^ Glossary of Meteorology (2009). "Wind sock". American Meteorological Society. Archived from the original on 2012-05-14. Retrieved 2009-03-17.
- ^ Glossary of Meteorology (2009). "Anemometer". American Meteorological Society. Archived from the original on 2011-06-06. Retrieved 2009-03-17.
- ^ Glossary of Meteorology (2009). "Pitot tube". American Meteorological Society. Archived from the original on 2012-05-14. Retrieved 2009-03-17.
- ^ Tropical Cyclone Weather Services Program (2006-06-01). "Tropical cyclone definitions" (PDF). National Weather Service. Retrieved 2006-11-30.
- ^ Office of the Federal Coordinator for Meteorology. Federal Meteorological Handbook No. 1 – Surface Weather Observations and Reports September 2005 Appendix A: Glossary. Retrieved 2008-04-06.
- ISBN 978-1-4020-5179-1. Retrieved 2009-04-22.
- ^ Jan-Hwa Chu (1999). "Section 2. Intensity Observation and Forecast Errors". United States Navy. Archived from the original on 2012-08-30. Retrieved 2008-07-04.
- ^ Glossary of Meteorology (2009). "Rawinsonde". American Meteorological Society. Archived from the original on 2011-06-06. Retrieved 2009-03-17.
- ^ Glossary of Meteorology (2009). "Pibal". American Meteorological Society. Archived from the original on 2007-11-10. Retrieved 2009-03-17.
- ISSN 0035-9009.
- ISSN 2073-4433.
- ^ ISBN 978-0-486-49541-5. Retrieved 2009-01-09.
- ^ Glossary of Meteorology (2009). "G". American Meteorological Society. Archived from the original on 2012-10-05. Retrieved 2009-03-18.
- ^ Glossary of Meteorology (2009). "Storm". American Meteorological Society. Archived from the original on 2007-10-15. Retrieved 2009-03-18.
- ^ Coastguard Southern Region (2009). "The Beaufort Wind Scale". Archived from the original on 2008-11-18. Retrieved 2009-03-18.
- ^ "Enhanced Fujita Scale". American Meteorological Society - Glossary of Meteorology. 7 November 2013. Retrieved 21 June 2021.
- Hydrometeorological Prediction Center. National Centers for Environmental Prediction. 2009. Retrieved 2007-05-16.
- ^ "How to read weather maps". JetStream. National Weather Service. 2008. Archived from the original on 2012-07-05. Retrieved 2009-06-27.
- ISBN 978-0-07-136103-3. Retrieved 2008-01-22.
- ISBN 978-0-8061-3146-7. Retrieved 2009-06-20.
- ^ Glossary of Meteorology (2000). "trade winds". American Meteorological Society. Archived from the original on 2008-12-11. Retrieved 2008-09-08.
- ^ a b Ralph Stockman Tarr and Frank Morton McMurry (1909). Advanced geography. W.W. Shannon, State Printing. p. 246. Retrieved 2009-04-15.
- ^ Joint Typhoon Warning Center (2006). "3.3 JTWC Forecasting Philosophies" (PDF). United States Navy. Archived from the original (PDF) on 2012-07-05. Retrieved 2007-02-11.
- Science Daily. 1999-07-14. Retrieved 2007-06-10.
- ^ Glossary of Meteorology (2009). "Monsoon". American Meteorological Society. Archived from the original on 2008-03-22. Retrieved 2008-03-14.
- ^ "Chapter-II Monsoon-2004: Onset, Advancement and Circulation Features" (PDF). National Centre for Medium Range Forecasting. 2004-10-23. Archived from the original (PDF) on 2011-07-21. Retrieved 2008-05-03.
- ^ "Monsoon". Australian Broadcasting Corporation. 2000. Archived from the original on 2001-02-23. Retrieved 2008-05-03.
- ^ Alex DeCaria (2007-10-02). "Lesson 4 – Seasonal-mean Wind Fields" (PDF). Millersville Meteorology. Retrieved 2008-05-03.
- ^ Glossary of Meteorology (2009). "Westerlies". American Meteorological Society. Archived from the original on 2010-06-22. Retrieved 2009-04-15.
- ^ Sue Ferguson (2001-09-07). "Climatology of the Interior Columbia River Basin" (PDF). Interior Columbia Basin Ecosystem Management Project. Archived from the original (PDF) on 2009-05-15. Retrieved 2009-09-12.
- ^ Halldór Björnsson (2005). "Global circulation". Veðurstofu Íslands. Archived from the original on 2011-08-07. Retrieved 2008-06-15.
- ^ National Environmental Satellite, Data, and Information Service (2009). "Investigating the Gulf Stream". North Carolina State University. Archived from the original on 2010-05-03. Retrieved 2009-05-06.
{{cite web}}: CS1 maint: multiple names: authors list (link) - ISBN 978-0-393-04555-0. Retrieved 2009-06-17.
Roaring Forties Shrieking Sixties westerlies.
- ^ Barbie Bischof; Arthur J. Mariano; Edward H. Ryan (2003). "The North Atlantic Drift Current". The National Oceanographic Partnership Program. Retrieved 2008-09-10.
- ^ Erik A. Rasmussen; John Turner (2003). Polar Lows. Cambridge University Press. p. 68.
- ^ Glossary of Meteorology (2009). "Polar easterlies". American Meteorological Society. Archived from the original on 2012-07-12. Retrieved 2009-04-15.
- ^ Michael E. Ritter (2008). "The Physical Environment: Global scale circulation". University of Wisconsin–Stevens Point. Archived from the original on 2009-05-06. Retrieved 2009-04-15.
- ^ Steve Ackerman (1995). "Sea and Land Breezes". University of Wisconsin. Retrieved 2006-10-24.
- S2CID 119993890.
- ^ JetStream: An Online School For Weather (2008). "The Sea Breeze". National Weather Service. Archived from the original on 2006-09-23. Retrieved 2006-10-24.
- ^ National Weather Service Forecast Office in Tucson, Arizona (2008). "What is a monsoon?". National Weather Service Western Region Headquarters. Retrieved 2009-03-08.
- .
- .
- ^ a b National Center for Atmospheric Research (2006). "T-REX: Catching the Sierra's waves and rotors". University Corporation for Atmospheric Research. Archived from the original on 2006-11-21. Retrieved 2006-10-21.
- ^ Anthony Drake (2008-02-08). "The Papaguayo Wind". NASA Goddard Earth Sciences Data and Information Services Center. Archived from the original on 2009-06-14. Retrieved 2009-06-16.
- ^ Michael Pidwirny (2008). "CHAPTER 8: Introduction to the Hydrosphere (e). Cloud Formation Processes". Physical Geography. Archived from the original on 2008-12-20. Retrieved 2009-01-01.
- ISBN 978-1-86940-297-6. Retrieved 2009-06-21.
- S2CID 120049170.
- .
- .
- ^ a b Rene Munoz (2000-04-10). "Boulder's downslope winds". University Corporation for Atmospheric Research. Archived from the original on 2012-03-19. Retrieved 2009-06-16.
- ^ D. C. Beaudette (1988). "FAA Advisory Circular Pilot Wind Shear Guide via the Internet Wayback Machine" (PDF). Federal Aviation Administration. Archived from the original (PDF) on 2006-10-14. Retrieved 2009-03-18.
- Hydrometeorological Prediction Center. Retrieved 2006-10-22.
- ^ Glossary of Meteorology (2007). "E". American Meteorological Society. Archived from the original on 2012-07-12. Retrieved 2007-06-03.
- ^ "Jet Streams in the UK". BBC. 2009. Archived from the original on 2009-02-14. Retrieved 2009-06-20.
- ^ a b Cheryl W. Cleghorn (2004). "Making the Skies Safer From Windshear". NASA Langley Air Force Base. Archived from the original on August 23, 2006. Retrieved 2006-10-22.
- ^ National Center for Atmospheric Research (Spring 2006). "T-REX: Catching the Sierra's waves and rotors". University Corporation for Atmospheric Research Quarterly. Archived from the original on 2009-02-21. Retrieved 2009-06-21.
- ISBN 978-90-6764-258-3. Retrieved 2009-06-21.
- ISBN 978-0-471-49456-0.
- ISBN 978-1-57409-000-0.
- National Aeronautic and Space Administration. Archived from the originalon October 9, 2007. Retrieved 2007-10-09.
- ^ Rene N. Foss (June 1978). Ground Plane Wind Shear Interaction on Acoustic Transmission (Report). WA-RD 033.1. Washington State Department of Transportation. Retrieved 2007-05-30.
- ^ University of Illinois (1999). "Hurricanes". Retrieved 2006-10-21.
- ^ University of Illinois (1999). "Vertical Wind Shear". Archived from the original on 2019-03-16. Retrieved 2006-10-21.
- ^ Integrated Publishing (2007). "Unit 6—Lesson 1: Low-Level Wind Shear". Retrieved 2009-06-21.
- ^ Laura Gibbs (2007-10-16). "Vayu". Encyclopedia for Epics of Ancient India. Retrieved 2009-04-09.
- ^ ISBN 978-0-8160-2909-9.
- ^ Theoi Greek Mythology (2008). "Anemi: Greek Gods of the Winds". Aaron Atsma. Retrieved 2009-04-10.
- ISBN 978-0-691-03680-9.
- ISBN 978-0-304-36385-8.
- ^ History Detectives (2008). "Feature – Kamikaze Attacks". PBS. Archived from the original on 2008-10-25. Retrieved 2009-03-21.
- ISBN 978-1-901341-14-0. Retrieved 2009-06-20.
- .
- ISBN 978-0-06-059767-2.
- ISBN 978-0-395-78033-6.
- Hodder and Stoughton. p. 30. Retrieved 2009-03-19.
structure of sailing ship.
- ^ Brandon Griggs & Jeff King (2009-03-09). "Boat made of plastic bottles to make ocean voyage". CNN. Retrieved 2009-03-19.
- ISBN 978-1-57409-007-9. Retrieved 2009-03-19.
- ISBN 978-1-59114-611-7. Retrieved 2009-06-20.
- ^ Underwater Archaeology Kids' Corner (2009). "Shipwrecks, Shipwrecks Everywhere". Wisconsin Historical Society. Archived from the original on 2008-05-13. Retrieved 2009-03-19.
- ISBN 978-0-521-44652-5. Retrieved 2009-03-19.
- ^ Tom Benson (2008). "Relative Velocities: Aircraft Reference". NASA Glenn Research Center. Retrieved 2009-03-19.
- ^ Library of Congress (2006-01-06). "The Dream of Flight". Library of Congress. Archived from the original on 2009-07-28. Retrieved 2009-06-20.
- Bristol International Airport. 2004. Archived from the original(PDF) on 2009-03-26. Retrieved 2009-03-19.
- S2CID 205026185.
- .
- ISBN 978-0-521-42239-0.
- .
- ^ IRENA. "Wind energy". International Renewable Energy Agency. Retrieved 2021-06-20.
- OCLC 1082243945.
- ^ The Physics of Wind Turbines. Kira Grogg Carleton College (2005) p. 8. (PDF). Retrieved 2011-11-03.
- ^ Glider Flying Handbook. U.S. Government Printing Office, Washington, D.C.: U.S. Federal Aviation Administration. 2003. pp. 7–16. FAA-8083-13_GFH. Archived from the original on 2005-12-18. Retrieved 2009-06-17.
- ISBN 978-0-9605676-4-5.
- ^ a b Vern Hofman & Dave Franzen (1997). "Emergency Tillage to Control Wind Erosion". North Dakota State University Extension Service. Retrieved 2009-03-21.
- ^ S2CID 38762011. Archived from the original(PDF) on 2010-06-01. Retrieved 2009-06-20.
- ^ United States Geological Survey (2004). "Dunes – Getting Started". Archived from the original on 2009-07-26. Retrieved 2009-03-21.
- S2CID 131245730.
- ISBN 978-3-540-27951-8.
- ISBN 978-0-697-38506-2.
- ^ Science Daily (1999-07-14). "African Dust Called A Major Factor Affecting Southeast U.S. Air Quality". Retrieved 2007-06-10.
- ^ Science Daily (2001-06-15). "Microbes And The Dust They Ride In On Pose Potential Health Risks". Retrieved 2007-06-10.
- ^ Usinfo.state.gov (2003). "Study Says African Dust Affects Climate in U.S., Caribbean" (PDF). Archived from the original (PDF) on 2007-06-20. Retrieved 2007-06-10.
- U. S. Geological Survey (2006). "Coral Mortality and African Dust". Archived from the originalon 2012-05-02. Retrieved 2007-06-10.
- ^ Weather Online (2009). "Calima". Retrieved 2009-06-17.
- .
- ^ Weather Online (2009). "Sirocco (Scirocco)". Retrieved 2009-06-17.
- ^ Bill Giles (O.B.E) (2009). "The Khamsin". BBC. Archived from the original on 2009-03-13. Retrieved 2009-06-17.
- ^ Thomas J. Perrone (August 1979). "Table of Contents: Wind Climatology of the Winter Shamal". United States Navy. Archived from the original on 2010-05-06. Retrieved 2009-06-17.
- ^ J. Gurevitch; S. M. Scheiner & G. A. Fox (2006). Plant Ecology, 2nd ed. Sinauer Associates, Inc., Massachusetts.
- JSTOR 2261699.
- ISBN 978-0-412-57450-4. Retrieved 2009-06-19.
- . Retrieved 2009-06-20.
- doi:10.1139/X08-174.
- ^ Michael A. Arnold (2009). "Coccoloba uvifera" (PDF). Texas A&M University. Archived from the original (PDF) on 2011-06-06. Retrieved 2009-06-20.
- Department of the Interior. Retrieved 2009-06-20.
- ^ ARS Studies Effect of Wind Sandblasting on Cotton Plants / January 26, 2010 / News from the USDA Agricultural Research Service. Ars.usda.gov. Retrieved 2011-11-03.
- ^ "ARS Studies Effect of Wind Sandblasting on Cotton Plants". USDA Agricultural Research Service. January 26, 2010.
- S2CID 42684382.
- S2CID 218563372.
- ^ "Gone with the wind: Revisiting stem rust dispersal between southern Africa and Australia". GlobalRust. Retrieved 2022-01-03.
- S2CID 40941822.
- PMID 1110212.
- ^ Australian Antarctic Division (2008-12-08). "Adapting to the Cold". Australian Government Department of the Environment, Water, Heritage, and the Arts Australian Antarctic Division. Archived from the original on 2009-06-15. Retrieved 2009-06-20.
- University of Illinoisat Urbana – Champaign. Retrieved 2009-04-26.
- ^ Gary Ritchison (2009-01-04). "BIO 554/754 Ornithology Lecture Notes 2 – Bird Flight I". Eastern Kentucky University. Retrieved 2009-06-19.
- ^ Bart Geerts & Dave Leon (2003). "P5A.6 Fine-Scale Vertical Structure of a Cold Front As Revealed By Airborne 95 GHZ Radar" (PDF). University of Wyoming. Retrieved 2009-04-26.
- ^ Thomas A. Niziol (August 1998). "Contamination of WSR-88D VAD Winds Due to Bird Migration: A Case Study" (PDF). Eastern Region WSR-88D Operations Note No. 12. Retrieved 2009-04-26.
- ISBN 978-0-226-64186-7.
- ISBN 978-0-306-41556-2. Retrieved 2009-06-19.
- ISBN 978-1-58574-180-9. Retrieved 2009-06-19.
- JSTOR 176831.
- ISBN 978-0-8061-3258-7. Retrieved 2009-05-13.
- ISBN 978-1-4020-9078-3. Retrieved 2009-05-13.
- ^ Derek Burch (2006-04-26). "How to Minimize Wind Damage in the South Florida Garden". University of Florida. Retrieved 2009-05-13.
- ^ National Hurricane Center (2006-06-22). "Saffir-Simpson Hurricane Scale Information". National Oceanic and Atmospheric Administration. Retrieved 2007-02-25.
- ^ "Enhanced F Scale for Tornado Damage". Storm Prediction Center. Retrieved June 21, 2009.
- ^ "Info note No.58 — World Record Wind Gust: 408 km/h". World Meteorological Association. 2010-01-22. Archived from the original on 2013-01-20.
- S2CID 10499171. Retrieved 2009-02-06.
- ^ National Wildfire Coordinating Group (2007-02-08). NWCG Communicator's Guide for Wildland Fire Management: Fire Education, Prevention, and Mitigation Practices, Wildland Fire Overview (PDF). p. 5. Archived from the original (PDF) on 2016-03-04. Retrieved 2008-12-11.
- ^ National Wildfire Coordinating Group (2008). Glossary of Wildland Fire Terminology (PDF). p. 73. Archived from the original (PDF) on 2008-08-21. Retrieved 2008-12-18.
- ^ Ashley King; et al. (February 21, 2012). "Chandra Finds Fastest Winds from Stellar Black Hole". NASA. Retrieved September 27, 2012.
- ^ Ruth Murray-Clay (2008). "Atmospheric Escape Hot Jupiters & Interactions Between Planetary and Stellar Winds" (PDF). Boston University. Archived from the original (PDF) on 2009-08-04. Retrieved 2009-05-05.
- .
- ^ ISBN 978-3-527-40671-5. Retrieved 2009-05-05.
- ^ "Solar Wind | NOAA / NWS Space Weather Prediction Center". www.swpc.noaa.gov. Retrieved 2023-05-16.
- National Aeronautic and Space Administration Marshall Space Flight Center. Retrieved 2009-03-19.
- ^ Robert Roy Britt (2000-03-15). "A Glowing Discovery at the Forefront of Our Plunge Through Space". SPACE.com.
- ^ John G. Kappenman; et al. (1997). "Geomagnetic Storms Can Threaten Electric Power Grid". Earth in Space. 9 (7): 9–11. Archived from the original on 2008-06-11. Retrieved 2009-03-19.
- ^ T. Neil Davis (1976-03-22). "Cause of the Aurora". Alaska Science Forum. Archived from the original on 2012-05-03. Retrieved 2009-03-19.
- National Aeronautics and Space Administration. Archived from the originalon 2015-03-21. Retrieved 2009-06-20.
- doi:10.1175/1520-0469(1990)047<2053:CTWFVO>2.0.CO;2.)
{{cite journal}}: CS1 maint: multiple names: authors list (link - ^ NASA (2004-12-13). "Mars Rovers Spot Water-Clue Mineral, Frost, Clouds". Retrieved 2006-03-17.
- ^ NASA – NASA Mars Rover Churns Up Questions With Sulfur-Rich Soil. Nasa.gov. Retrieved 2011-11-03.
- ^ David, Leonard (12 March 2005). "Spirit Gets A Dust Devil Once-Over". Space.com. Retrieved 2006-12-01.
- ^ A. P. Ingersoll; T. E. Dowling; P. J. Gierasch; G. S. Orton; P. L. Read; A. Sanchez-Lavega; A. P. Showman; A. A. Simon-Miller; A. R. Vasavada (2003-07-29). Dynamics of Jupiter's Atmosphere (PDF). Lunar & Planetary Institute. Retrieved 2007-02-01.
- S2CID 9210768.
- .
- doi:10.1016/j.icarus.2004.11.012. Archived from the original(PDF) on 2007-10-25. Retrieved 2009-06-15.
- .
- ISBN 978-0-8160-5197-7.
- .
- ^ "Exoplanet Sees Extreme Heat Waves". Space.com. 28 January 2009. Archived from the original on 3 June 2009. Retrieved 2 September 2017.
