
File:Synthetic aerosol distribution in number area and volume space.png

Original file (1,320 × 1,784 pixels, file size: 238 KB, MIME type: image/png)
 | This file was uploaded to Wikimedia Commons as File:Synthetic aerosol distribution in number area and volume space.png and deleted. Please check the reason for deletion on Commons before repeated transfer. |
| This graph image was SVG format, as a vector graphic. If possible, please upload an SVG version of this image. After confirming it is of comparable quality, please replace all instances of the previous version throughout Wikipedia (noted under the "File links" header), tag the old version with {{Vector version available|NewImage.svg}}, and remove this tag. For more information, see Wikipedia:Preparing images for upload. For assistance with converting to SVG, please see the Graphics Lab.Do not re-draw or auto-trace non-free images; instead, seek out vector versions from official sources. |  |
Summary
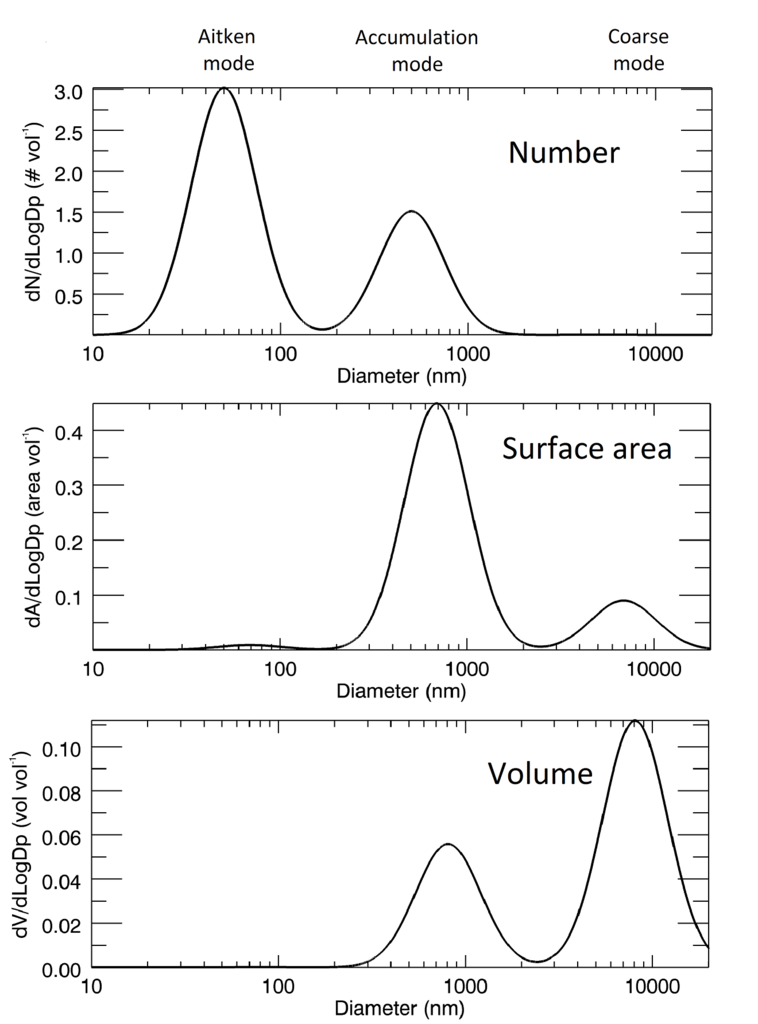
The same synthetic, tri-modal log-normal aerosol distribution plotted in three different spaces : number/size, surface area/size and volume size. Each distribution is normalised so that the area under each curve = 1000. Author: Niall Robinson. Source: Plotted from scratch by Niall Robinson. Niallrobinson (talk) 10:51, 17 September 2012 (UTC)
Licensing
| This file is made available under the Creative Commons CC0 1.0 Universal Public Domain Dedication.
The person who associated a work with this deed has dedicated the work to the public domain by waiving all of his or her rights to the work worldwide under copyright law, including all related and neighboring rights, to the extent allowed by law. You can copy, modify, distribute and perform the work, even for commercial purposes, all without asking permission. |
File history
Click on a date/time to view the file as it appeared at that time.
| Date/Time | Thumbnail | Dimensions | User | Comment | |
|---|---|---|---|---|---|
| current | File Upload Wizard ) | ||||
| 10:52, 17 September 2012 |  | 3,298 × 4,458 (644 KB) | Niallrobinson (talk | contribs) | The same synthetic, tri-modal log-normal aerosol distribution plotted in three different spaces : number/size, surface area/size and volume size. Each distribution is normalised so that the area under each curve = 1000. Author: Niall Robinson. Source: ... | |
| 10:51, 17 September 2012 |  | 3,298 × 4,458 (644 KB) | Niallrobinson (talk | contribs) | The same synthetic, tri-modal log-normal aerosol distribution plotted in three different spaces : number/size, surface area/size and volume size. Each distribution is normalised so that the area under each curve = 1000. Author: Niall Robinson. Source: ... |
You cannot overwrite this file.