
File:UsNaturalGasProductionAndPrices.png
UsNaturalGasProductionAndPrices.png (636 × 456 pixels, file size: 5 KB, MIME type: image/png)
Summary
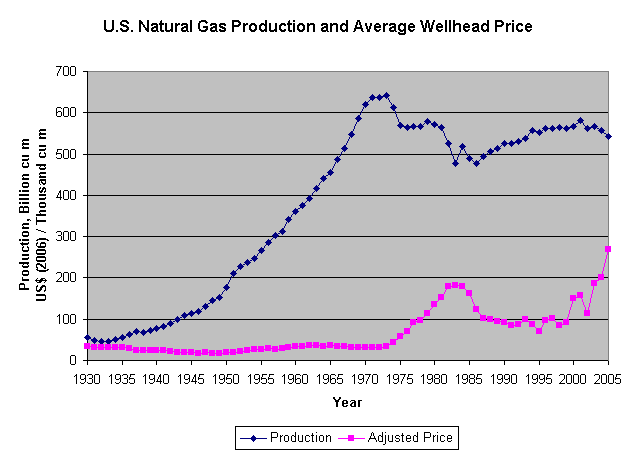
Chart of U.S. natural gas production (million cubic meters) and average wellhead prices (adjusted to spring, 2006 by U.S. CPI, per thousand cubic meters) for years from 1930 through 2005, Natural gas data from Energy Information Administration, U.S. Department of Energy, U.S. Consumer Price Index, Averaged by Year, National, All Urban Consumers, All Items, 1982-1984=100, from U.S. Bureau of Labor Statistics
Licensing
 | I, the creator of this work, hereby grant the permission to copy, distribute and/or modify this document under the terms of the GNU Free Documentation License, Version 1.2 or any later version published by the Free Software Foundation; with no Invariant Sections, no Front-Cover Texts, and no Back-Cover Texts. Subject to disclaimers. |
| This work is licensed under the Creative Commons Attribution-ShareAlike 3.0 License. This licensing tag was added to this file as part of the GFDL licensing update. |
 | This file is a candidate to be copied to Wikimedia Commons.
Any user may perform this transfer; refer to Wikipedia:Moving files to Commons for details. If this file has problems with attribution, copyright, or is otherwise ineligible for Commons, then remove this tag and DO NOT transfer it; repeat violators may be blocked from editing. Other Instructions
| ||
| |||
File history
Click on a date/time to view the file as it appeared at that time.
| Date/Time | Thumbnail | Dimensions | User | Comment | |
|---|---|---|---|---|---|
| current | 15:01, 9 May 2006 | | 636 × 456 (5 KB) | Craig Bolon (talk | contribs) | Chart of U.S. natural gas production (million cubic meters) and average wellhead prices (adjusted to spring, 2006 by U.S. CPI, per thousand cubic meters) for years from 1930 through 2005, Natural gas data from Energy Information Administration, U.S. Depar |
| 14:19, 9 May 2006 |  | 637 × 455 (5 KB) | Craig Bolon (talk | contribs) | Chart of U.S. natural gas production (million cubic meters) and average wellhead prices (adjusted to spring, 2006 by U.S. CPI, per thousand cubic meters) for years from 1930 through 2005, Natural gas data from Energy Information Administration, U.S. Depar | |
| 11:37, 9 May 2006 |  | 637 × 455 (5 KB) | Craig Bolon (talk | contribs) | Chart of U.S. natural gas production (million cubic meters) and average wellhead prices (adjusted to spring, 2006 by U.S. CPI, per thousand cubic meters) for years from 1930 through 2004, Natural gas data from Energy Information Administration, U.S. Depar |
You cannot overwrite this file.