
Seven basic tools of quality
Examples
-

-
 Check sheet
 -
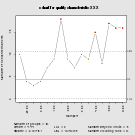 Control chart
 -
 Histogram
 -

-
 Scatter diagram
 -
 Flow chart
 -
 Run chart


The seven basic tools of quality are a fixed set of visual exercises identified as being most helpful in troubleshooting issues related to quality.[1] They are called basic because they are suitable for people with little formal training in statistics and because they can be used to solve the vast majority of quality-related issues.[2]
Overview
- Cause-and-effect diagram (also known as the "fishbone diagram" or Ishikawa diagram)
- Check sheet
- Control chart
- Histogram
- Pareto chart
- Scatter diagram
- flow chart or run chart)
The designation arose in
A Guide to the Project Management Body of Knowledge as an example of a set of general tools useful for planning or controlling project quality.[9]
The seven basic tools stand in contrast to more advanced statistical methods such as
multivariate analysis, and various methods developed in the field of operations research.[10]
See also
- A3 problem solving – Structured problem improvement approach
- Eight disciplines problem solving – Eight disciplines of team-oriented problem solving method
- Seven management and planning tools – Tools used for management and planning.
References
Footnotes
- ^ Montgomery 2005, p. 148.
- ^ Ishikawa 1985, p. 198: "From my past experience as much as ninety percent of all problems within a company can be solved by means of these tools."
- ^ Tague 2005, p. 15.
- ^ Ishikawa 1985, p. 198: "Elementary Statistical Method (the so-called Seven Tools) 1. Pareto chart: The principle of vital few; trivial many 2. Cause and effect diagram (This is not precisely a statistical technique) 3. Stratification 4. Check sheet 5. Histogram. 6. Scatter diagram (analysis of correlation through determination of median; in some instances, use of binomial probability paper) 7. Graph and control chart (Shewhart control chart)".
- ^ Imai 1986, pp. 239–240: "The seven statistical tools used for such analytical problem-solving are: 1. Pareto diagrams ... 2. Cause-and-effect diagrams ... 3. Histograms ... 4. Control charts ... 5. Scatter diagrams ... 6. Graphs ... 7. Checksheets."
- ^ Ishikawa 1990, p. 98: "They were named the Seven QC Tools after the famous seven weapons of the Japanese Kamakura-era warrior-priest Benkei which enabled Benkei to triumph in battle; so too, the Seven QC Tools, if used skillfully, will enable 95% of workplace problems to be solved. In other words, intermediate and advanced statistical tools are needed in about only 5% of cases."
- ^ Moore, Matthew (30 November 2007). "The Seven Basic Tools of Quality". Improvementandinnovation.com. London. Archived from the original on 19 October 2012. Retrieved 18 May 2013.
- ^ Ishikawa 1985, p. 18: "It is true that statistical methods are effective, but we overemphasized their importance. As a result, people either feared or disliked quality control as something very difficult. We overeducated people by giving them sophisticated methods where, at that stage, simple methods would have sufficed."
- ^ Project Management Institute 2013, pp. 236–238.
- ^ Ishikawa 1985, pp. 198–199: "I divide statistical methods into the following three categories according to their level of difficulty. 1. Elementary Statistical Method (the so-called Seven Tools) ... 2. Intermediate Statistical Method ... 3. Advanced Statistical Method (using computers concurrently)".
Bibliography
- Duffy, Grace L.; Furterer, Sandra L. (8 June 2020). "Chapter 9. Improvement Tools". The ASQ Certified Quality Improvement Associate Handbook. Quality Press. ISBN 978-1-951058-13-5.
- ISBN 978-0-394-55186-9.
- ISBN 978-0-13-952433-2.
- ISBN 978-4-906224-61-6.
- Montgomery, Douglas (2005). Introduction to Statistical Quality Control. Hoboken, New Jersey: John Wiley & Sons. ISBN 978-0-471-65631-9.
- ISBN 978-1-935589-67-9.
- Tague, Nancy R. (2005). The Quality Toolbox (2nd ed.). Milwaukee, Wisconsin: ASQ Quality Press. ISBN 978-1-62198-045-2.