This section describes the mathematically simplest situation where topographic Rossby waves form: a uniform bottom slope.
Shallow water equations
A coordinate system is defined with x in eastward direction, y in northward direction and z as the distance from the earth's surface. The coordinates are measured from a certain reference coordinate on the earth's surface with a reference latitude and a mean reference layer thickness . The derivation begins with the shallow water equations:
where
is the velocity in the x direction, or
zonal
velocity
is the velocity in the y direction, or
meridional
velocity
is the local and instantaneous fluid layer thickness
is the height deviation of the fluid from its mean height
at the reference coordinate with , where is the angular frequency of the Earth and is the reference latitude
In the equation above, friction (
kinematic viscosity) is neglected. Furthermore, a constant Coriolis parameter is assumed ("f-plane approximation"). The first and the second equation of the shallow water equations are respectively called the zonal and meridional momentum equations, and the third equation is the continuity equation. The shallow water equations assume a homogeneous and barotropic
fluid.
Linearization
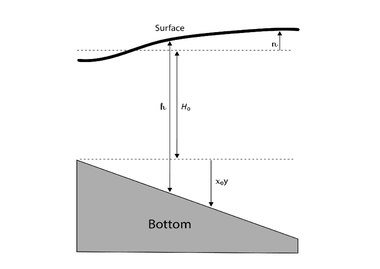
For simplicity, the system is limited by means of a weak and uniform bottom slope that is aligned with the y-axis, which in turn enables a better comparison to the results with planetary Rossby waves. The mean layer thickness for an undisturbed fluid is then defined as
A layer of homogeneous fluid over a sloping bottom and the attending notation.
where is the slope of bottom, the topographic parameter and the horizontal length scale of the motion. The restriction on the topographic parameter guarantees that there is a weak bottom irregularity. The local and instantaneous fluid thickness can be written as
Utilizing this expression in the continuity equation of the shallow water equations yields
The set of equations is made linear to obtain a set of equations that is easier to solve analytically. This is done by assuming a Rossby number Ro (= advection / Coriolis force), which is much smaller than the temporal Rossby number RoT (= inertia / Coriolis force). Furthermore, the length scale of is assumed to be much smaller than the thickness of the fluid . Finally, the condition on the topographic parameter is used and the following set of linear equations is obtained:
Quasi-geostrophic approximation
Next, the quasi-geostrophic approximation Ro, RoT 1 is made, such that
where and are the geostrophic flow components and and are the ageostrophic flow components with and . Substituting these expressions for and in the previously acquired set of equations, yields:
Neglecting terms where small component terms ( and ) are multiplied, the expressions obtained are:
Substituting the components of the ageostrophic velocity in the continuity equation the following result is obtained:
If there is no bottom slope (), the expression above yields no waves, but a steady and geostrophic flow. This is the reason why these waves are called topographic Rossby waves.
The maximum frequency of the topographic Rossby waves is
which is attained for and . If the forcing creates waves with frequencies above this threshold, no Rossby waves are generated. This situation rarely happens, unless is very small. In all other cases exceeds and the theory breaks down. The reason for this is that the assumed conditions: and RoT are no longer valid. The shallow water equations used as a starting point also allow for other types of waves such as
Poincaré waves
). However, these do not appear in the obtained results because of the quasi-geostrophic assumption which is used to obtain this result. In wave dynamics this is called filtering.
Phase speed
The phase speed of the waves along the isobaths (lines of equal depth, here the x-direction) is
The phase speed of topographic Rossby waves in x-direction on the northern hemisphere.
which means that on the northern hemisphere the waves propagate with the shallow side at their right and on the southern hemisphere with the shallow side at their left. The equation of shows that the phase speed varies with wavenumber so the waves are dispersive. The maximum of is
which is the speed of very long waves (). The phase speed in the y-direction is
which means that can have any sign. The phase speed is given by
from which it can be seen that as . This implies that the maximum of is the maximum of .[1]
Analogy between topographic and planetary Rossby waves
Planetary and topographic Rossby waves are the same in the sense that, if the term is exchanged for in the expressions above, where is the beta-parameter or Rossby parameter, the expression of planetary Rossby waves is obtained. The reason for this similarity is that for the nonlinear shallow water equations for a frictionless, homogeneous flow the potential vorticity q is conserved:
with being the
relative vorticity
, which is twice the rotation speed of fluid elements about the z-axis, and is mathematically defined as
with an anticlockwise rotation about the z-axis. On a beta-plane and for a linearly sloping bottom in the meridional direction, the potential vorticity becomes
.
In the derivations above it was assumed that
so
where a
Taylor expansion
was used on the denominator and the dots indicate higher order terms. Only keeping the largest terms and neglecting the rest, the following result is obtained:
Consequently, the analogy that appears in potential vorticity is that and play the same role in the potential vorticity equation. Rewriting these terms a bit differently, this boils down to the earlier seen and , which demonstrates the similarity between planetary and topographic Rossby waves. The equation for potential vorticity shows that planetary and topographic Rossby waves exist because of a background gradient in potential vorticity.
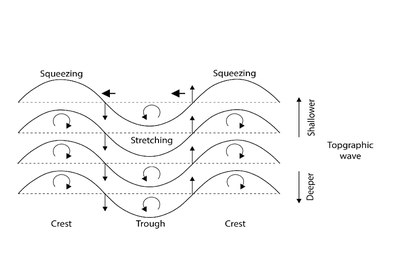
The physical mechanisms that propel topographic waves. Displaced fluid parcels react to their new location by developing either clockwise or counterclockwise vorticity. Intermediate parcels are entrained by neighboring vortices, and the wave progresses forward.
The analogy between planetary and topographic Rossby waves is exploited in laboratory experiments that study geophysical flows to include the beta effect which is the change of the
Coriolis parameter over the earth. The water vessels used in those experiments are far too small for the Coriolis parameter to vary significantly. The beta effect can be mimicked to a certain degree in these experiments by using a tank with a sloping bottom. The substitution of the beta effect by a sloping bottom is only valid for a gentle slope, slow fluid motions and in the absence of stratification.[1]
Conceptual explanation
As shown in the last section, Rossby waves are formed because potential vorticity must be conserved. When the surface has a slope, the thickness of the fluid layer is not constant. The conservation of the potential vorticity forces the relative vorticity or the Coriolis parameter to change. Since the Coriolis parameter is constant at a given latitude, the relative vorticity must change. In the figure a fluid moves to a shallower environment, where is smaller, causing the fluid to form a crest. When the height is smaller, the relative vorticity must also be smaller. In the figure, this becomes a negative relative vorticity (on the northern hemisphere a clockwise spin) shown with the rounded arrows. On the southern hemisphere this is an anticlockwise spin, because the Coriolis parameter is negative on the southern hemisphere. If a fluid moves to a deeper environment, the opposite is true. The fluid parcel on the original depth is sandwiched between two fluid parcels with one of them having a positive relative vorticity and the other one a negative relative vorticity. This causes a movement of the fluid parcel to the left in the figure. In general, the displacement causes a wave pattern that propagates with the shallower side to the right on the northern hemisphere and to the left on the southern hemisphere.[1]
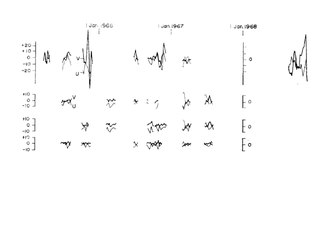
Measurements of topographic Rossby waves in the Northern Atlantic.[2] Northward (thicker lines) and eastward (thinner lines) velocity measurements in cm/s at 100, 500, 1000 and 2000 meters depth.
Measurements of topographic Rossby waves on earth
From 1 January 1965 till 1 January 1968, The Buoy Project at the Woods Hole Oceanographic Institution dropped buoys on the western side of the Northern Atlantic to measure the velocities. The data has several gaps because some of the buoys went missing. Still they managed to measure topographic Rossby waves at 500 meters depth.[2] Several other research projects have confirmed that there are indeed topographic Rossby waves in the Northern Atlantic.[3][4][5]
In 1988, barotropic planetary Rossby waves were found in the Northwest Pacific basin.[6] Further research done in 2017 concluded that the Rossby waves are no planetary Rossby waves, but topographic Rossby waves.[7]
In 2021, research in the South China Sea confirmed that topographic Rossby waves exist.[8][9]
In 2016, research in the East Mediterranean showed that topographic Rossby Waves are generated south of Crete due to lateral shifts of a mesoscale circulation structure over the sloping bottom at 4000 m (https://doi.org/10.1016/j.dsr2.2019.07.008).


![{\displaystyle {\begin{aligned}{\partial u \over \partial t}&+u{\partial u \over \partial x}+v{\partial u \over \partial y}-f_{0}v=-g{\partial \eta \over \partial x}\\[3pt]{\partial v \over \partial t}&+u{\partial v \over \partial x}+v{\partial v \over \partial y}+f_{0}u=-g{\partial \eta \over \partial y}\\[3pt]{\partial \eta \over \partial t}&+{\partial \over \partial x}hu+{\partial \over \partial y}hv=0,\end{aligned}}}](https://wikimedia.org/api/rest_v1/media/math/render/svg/36484b02b3f50f8d2130308701aad6cc62b1acad)


![{\displaystyle {\begin{aligned}{\partial u \over \partial t}&-f_{0}v=-g{\partial \eta \over \partial x}\\[3pt]{\partial v \over \partial t}&+f_{0}u=-g{\partial \eta \over \partial y}\\[3pt]{\partial \eta \over \partial t}&+H_{0}\left({\partial u \over \partial x}+{\partial v \over \partial y}\right)+\alpha _{0}v=0.\end{aligned}}}](https://wikimedia.org/api/rest_v1/media/math/render/svg/db514b361a1ba7378795b982ead1e69436efa5cb)

![{\displaystyle {\begin{aligned}u={\bar {u}}+{\tilde {u}}\qquad &{\text{with}}\qquad {\bar {u}}=-{g \over f_{0}}{\partial \eta \over \partial y}\\[3pt]v={\bar {v}}+{\tilde {v}}\qquad &{\text{with}}\qquad {\bar {v}}={g \over f_{0}}{\partial \eta \over \partial x},\\[3pt]\end{aligned}}}](https://wikimedia.org/api/rest_v1/media/math/render/svg/520ad5eea31a3e81582b99a01bf2f8c2772d560e)


![{\displaystyle {\begin{aligned}&-{g \over f_{0}}{\partial ^{2}\eta \over \partial y\partial t}+{\partial {\tilde {u}} \over \partial t}-f_{0}{\tilde {v}}=0\\[3pt]&{g \over f_{0}}{\partial ^{2}\eta \over \partial x\partial t}+{\partial {\tilde {v}} \over \partial t}+f_{0}{\tilde {u}}=0\\[3pt]&{\partial \eta \over \partial t}+H_{0}\left({\partial {\tilde {u}} \over \partial x}+{\partial {\tilde {v}} \over \partial y}\right)+\alpha _{0}{g \over f_{0}}{\partial \eta \over \partial x}+\alpha _{0}{\tilde {v}}=0.\end{aligned}}}](https://wikimedia.org/api/rest_v1/media/math/render/svg/00593bc04e37b897fe6e71f269d9369305c0e17d)

![{\displaystyle {\begin{aligned}&{\tilde {v}}=-{g \over f_{0}^{2}}{\partial ^{2}\eta \over \partial y\partial t}\\[3pt]&{\tilde {u}}=-{g \over f_{0}^{2}}{\partial ^{2}\eta \over \partial x\partial t}\\[3pt]&{\partial \eta \over \partial t}+H_{0}\left({\partial {\tilde {u}} \over \partial x}+{\partial {\tilde {v}} \over \partial y}\right)+\alpha _{0}{g \over f_{0}}{\partial \eta \over \partial x}=0.\end{aligned}}}](https://wikimedia.org/api/rest_v1/media/math/render/svg/034a34c9f8e070947153935e3f688a158055c20f)


![{\displaystyle {\begin{aligned}\beta _{0}L\ll \left\vert f_{0}\right\vert &{\text{ : small planetary number }}\beta \\[3pt][\zeta ]\ll \left\vert f_{0}\right\vert &{\text{ : small Rossby number Ro}}\\[3pt]\alpha _{0}L\ll H_{0}&{\text{ : small topographic parameter }}\alpha \\[3pt]\Delta H\ll H&{\text{ : linear dynamics}},\end{aligned}}}](https://wikimedia.org/api/rest_v1/media/math/render/svg/1862261afd794ed27337dee068a0d911b2192ea4)