
Trinity Center, California
Trinity Center | |
|---|---|
UTC-7 (PDT) | |
| ZIP Code | 96091 |
| Area code | 530 |
| GNIS feature ID | 2583167 |
| U.S. Geological Survey Geographic Names Information System: Trinity Center, California | |
Trinity Center is a census-designated place (CDP) in Trinity County, California, United States.[2] Trinity Center is located 29 miles (47 km) north of Weaverville. It is home to Trinity Lake, a popular summer tourist destination. It is home to a store, Trinity Center Airport, a marina, a community church, several campgrounds, and several small resorts.
Coffee Creek is close by. The ZIP code is 96091. Trinity Center sits at an elevation of 2,390 feet (730 m).[2] Its population is 198 as of the 2020 census, down from 267 from the 2010 census.
History
The original town of Trinity Center was established in 1851 as a stage stop for travelers headed further north and now lies beneath the lake, which came into existence after the construction of the Trinity River Dam in 1961. A handful of buildings were moved to the town's present day location, including the I.O.O.F. building and several residences. Trinity Center was a gold mining town, shown by the mine tailings left at the north end of the lake.
Geography
According to the United States Census Bureau, the CDP covers an area of 5.2 square miles (13.5 km2), all of it land.
Climate
According to the
| Climate data for Trinity River Hatchery, California, 1991–2020 normals, extremes 1974–present | |||||||||||||
|---|---|---|---|---|---|---|---|---|---|---|---|---|---|
| Month | Jan | Feb | Mar | Apr | May | Jun | Jul | Aug | Sep | Oct | Nov | Dec | Year |
| Record high °F (°C) | 70 (21) |
81 (27) |
85 (29) |
94 (34) |
101 (38) |
111 (44) |
116 (47) |
113 (45) |
114 (46) |
99 (37) |
83 (28) |
67 (19) |
116 (47) |
| Mean maximum °F (°C) | 58.4 (14.7) |
67.6 (19.8) |
75.3 (24.1) |
83.6 (28.7) |
91.5 (33.1) |
100.0 (37.8) |
105.0 (40.6) |
103.5 (39.7) |
99.4 (37.4) |
89.4 (31.9) |
71.9 (22.2) |
56.8 (13.8) |
106.6 (41.4) |
| Mean daily maximum °F (°C) | 50.0 (10.0) |
56.0 (13.3) |
61.5 (16.4) |
67.7 (19.8) |
77.3 (25.2) |
86.5 (30.3) |
95.6 (35.3) |
94.4 (34.7) |
88.8 (31.6) |
75.6 (24.2) |
58.4 (14.7) |
48.2 (9.0) |
71.7 (22.0) |
| Daily mean °F (°C) | 41.4 (5.2) |
44.5 (6.9) |
48.4 (9.1) |
52.7 (11.5) |
60.6 (15.9) |
67.6 (19.8) |
74.8 (23.8) |
73.1 (22.8) |
67.2 (19.6) |
57.1 (13.9) |
47.1 (8.4) |
40.2 (4.6) |
56.2 (13.5) |
| Mean daily minimum °F (°C) | 32.7 (0.4) |
32.9 (0.5) |
35.4 (1.9) |
37.7 (3.2) |
44.0 (6.7) |
48.6 (9.2) |
54.0 (12.2) |
51.9 (11.1) |
45.6 (7.6) |
38.6 (3.7) |
35.6 (2.0) |
32.3 (0.2) |
40.8 (4.9) |
| Mean minimum °F (°C) | 23.5 (−4.7) |
23.7 (−4.6) |
27.6 (−2.4) |
29.2 (−1.6) |
34.1 (1.2) |
39.0 (3.9) |
46.9 (8.3) |
45.1 (7.3) |
37.3 (2.9) |
29.6 (−1.3) |
25.0 (−3.9) |
23.5 (−4.7) |
19.1 (−7.2) |
| Record low °F (°C) | 12 (−11) |
10 (−12) |
20 (−7) |
23 (−5) |
27 (−3) |
33 (1) |
37 (3) |
38 (3) |
32 (0) |
20 (−7) |
15 (−9) |
4 (−16) |
4 (−16) |
| Average precipitation inches (mm) | 5.95 (151) |
4.71 (120) |
4.07 (103) |
2.57 (65) |
1.69 (43) |
0.86 (22) |
0.19 (4.8) |
0.14 (3.6) |
0.33 (8.4) |
1.94 (49) |
3.50 (89) |
6.45 (164) |
32.40 (823) |
| Average snowfall inches (cm) | 1.2 (3.0) |
1.6 (4.1) |
0.3 (0.76) |
0.0 (0.0) |
0.0 (0.0) |
0.0 (0.0) |
0.0 (0.0) |
0.0 (0.0) |
0.0 (0.0) |
0.0 (0.0) |
0.6 (1.5) |
2.7 (6.9) |
6.4 (16.26) |
| Average precipitation days (≥ 0.01 in) | 14.8 | 12.3 | 13.1 | 9.5 | 7.5 | 3.2 | 1.0 | 1.0 | 1.9 | 5.3 | 10.8 | 14.8 | 95.2 |
| Average snowy days (≥ 0.1 in) | 1.1 | 0.7 | 0.2 | 0.1 | 0.0 | 0.0 | 0.0 | 0.0 | 0.0 | 0.0 | 0.3 | 1.4 | 3.8 |
| Source 1: NOAA[4] | |||||||||||||
| Source 2: National Weather Service[3] | |||||||||||||
Demographics
The
The Census reported that 267 people (100% of the population) lived in households, 0 (0%) lived in non-institutionalized group quarters, and 0 (0%) were institutionalized.
There were 137 households, out of which 15 (10.9%) had children under the age of 18 living in them, 80 (58.4%) were
The population was spread out, with 24 people (9.0%) under the age of 18, 7 people (2.6%) aged 18 to 24, 29 people (10.9%) aged 25 to 44, 98 people (36.7%) aged 45 to 64, and 109 people (40.8%) who were 65 years of age or older. The median age was 62.0 years. For every 100 females, there were 97.8 males. For every 100 females age 18 and over, there were 94.4 males.
There were 327 housing units at an average density of 62.5 per square mile (24.1/km2), of which 110 (80.3%) were owner-occupied, and 27 (19.7%) were occupied by renters. The homeowner vacancy rate was 8.9%; the rental vacancy rate was 0%. 202 people (75.7% of the population) lived in owner-occupied housing units and 65 people (24.3%) lived in rental housing units.
Politics
In the
Federally, Trinity Center is in California's 2nd congressional district, represented by Democrat Jared Huffman.[8]
See also
References
- ^ U.S. Census Archived 2012-01-25 at the Wayback Machine
- ^ a b c U.S. Geological Survey Geographic Names Information System: Trinity Center, California
- ^ a b "NOAA Online Weather Data – NWS Eureka". National Weather Service. Retrieved March 28, 2023.
- ^ "U.S. Climate Normals Quick Access – Station: Trinity RVR Hatchery, CA". National Oceanic and Atmospheric Administration. Retrieved March 28, 2023.
- ^ "2010 Census Interactive Population Search: CA - Trinity Center CDP". U.S. Census Bureau. Archived from the original on July 15, 2014. Retrieved July 12, 2014.
- ^ "Senators". State of California. Retrieved March 10, 2013.
- ^ "Members Assembly". State of California. Retrieved March 2, 2013.
- ^ "California's 2nd Congressional District - Representatives & District Map". Civic Impulse, LLC. Retrieved March 1, 2013.
External links
Municipalities and communities of Trinity County, California, United States | ||
|---|---|---|
| CDPs | 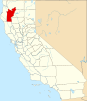 | |
| Unincorporated communities | ||
| Indian reservation | ||
| Ghost towns | ||
| Footnotes | ‡This populated place also has portions in an adjacent county or counties | |
| ||