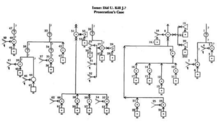
Wigmore chart

A Wigmore chart (commonly referred to as Wigmorean analysis) is a
belief network.[3]
After completing his Treatise in 1904, Wigmore "became convinced that something was missing." He set up a system for analyzing evidence that consisted of lines, used to represent reasoning, explanations, refutations, and conclusions; and shapes which represent facts, claims, explanations, and refutations.[4]
Although Wigmore taught his analytic method in the classroom during the early 20th century, the Wigmore chart was all but forgotten by the 1960s.[4] Recent scholars have rediscovered his work and used it as a basis for modern analytic standards.[5]
See also
References
- ^ Anderson et al. (2005), Chapter 5
- ^ Wigmore (1913), (1937)
- ^ Kadane & Schum (1996) pp66-76
- ^ .
- ISBN 9780810116764.
Bibliography
- Anderson, T.; et al. (2005). Analysis of Evidence (2nd ed.). Cambridge: Cambridge University Press. ISBN 0-521-67316-X.
- Kadane, J. B. & Schum, D. A. (1996). A Probabilistic Analysis of the Sacco and Vanzetti Evidence. New York: Wiley. ISBN 0-471-14182-8.
- Wigmore, J. H. (1913). "The problem of proof". Illinois Law Review. 8 (2): 77–103.
- Wigmore, J. H. (1937). The Science of Judicial Proof: As Given by Logic, Psychology and General Experience and Illustrated in Judicial Trials (3rd ed.). Boston: Little, Brown.
