
Wikipedia:Graphics Lab/Map workshop/Archive/Jul 2021
| This page is an archive. Do not edit the contents of this page. Please direct any additional comments to the current main page. |

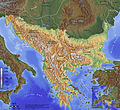
Request: New svg map of the Balkans
-
 Current map of the balkans
 -
 Good example of geographic map
 -
 Idealy something similar to this map would be perfect


- Article(s)
- Balkans
- Request
Hello, there is currently no topographic map available in svg format that covers the whole Balkan Peninsula. The only map we have is a not detailed and outdated jpg map. It would be nice to have something similar to the recently made map of the Carpathian Mountains.
- Discussion
- Pinging Talk∕Contribs13:35, 27 June 2021 (UTC)
![]() Done Map here--Ikonact (talk) 08:02, 15 October 2021 (UTC)
Done Map here--Ikonact (talk) 08:02, 15 October 2021 (UTC)
Request for an area map for the sea area known as the Bay of Granville where there's a current fisheries dispute between Britain and France
-
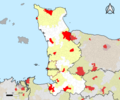 This left side of this map covers the area needed
 -
 Or this one

.jpg)
- Article(s)
- 2021 Jersey dispute
- Request
- I'm working on bringing 2021 Jersey dispute up to GA standard. Commons has various maps showing the location of the island of Jersey and the adjacent coasts of France. What this article needs is to show label the location of:
- Saint Helierharbour on Jersey
- two ports on the Normandy coast - Barneville-Carteret, Granville, Manche
- one port in Brittany - Saint-Malo
- two uninhabited reefs - the Minquiers and Écréhous
- outline of the three and twelve mile limits of territorial sea around Jersey - there are various sources but this one is probably the simplest
Any help gratefully received! -- Curb Safe Charmer (talk) 15:27, 4 July 2021 (UTC)
- Discussion
Request: Map of Amhara Region elevation + subdivision lines

- Article(s)
- Amhara Region
- Request
- Hello, i need someone with a great eye for detail who can make a map of the Amhara Region elevations and overlapping it with the subdivision lines, see the gallery for Amhara Region subdivision/zones in yellow. Here's a elevation map https://www.researchgate.net/figure/Elevation-map-of-Amhara-region-Ethiopia-depicting-the-4-sites-Site-1-Gondar-Site-2_fig1_337519745 note: between point 1 & 4 is Lake Tana, not shown in the elevation map, see map of zones(gallery) instead. So something like the Researchgate map but with the subdivision lines(and Lake Tana) included would be useful. Thank you Dawit S Gondaria (talk) 22:25, 20 July 2021 (UTC)
- Discussion
![]() Request taken by --always ping me-- Goran tek-en (talk) 10:11, 2 August 2021 (UTC).
Request taken by --always ping me-- Goran tek-en (talk) 10:11, 2 August 2021 (UTC).
- Dawit S Gondaria Here is two drafts as PNG versions of the original SVG file I'm working in and will upload to commons.
- Feedback, thanks. --always ping me-- Goran tek-en (talk) 15:20, 4 August 2021 (UTC)
- @@Goran tek-en: thank you for taking this request, and it's a good attempt.
- Except i can't tell the difference between 1000-1500 m & 1500-2000 m elevations it looks like just one space.
- I also can't tell the difference between 2000-2500 m & above 2500 m.
- @@Goran tek-en: thank you for taking this request, and it's a good attempt.
- Is it possible to do the coloring like the Researchgate? Maybe i should have added additional info like the climate regions, which is defined by elevation? 31% of the area is a Hot Zone(Kola) elevation 1500 or less meters. 44% of the area is a Warm Zone(Woyina Dega) elevation 1500-2500 meters. 25% of the area is a Cold Zone(Dega) with elevation above 2500 meters. See page 324 [1] Thanks again Dawit S Gondaria (talk) 03:18, 5 August 2021 (UTC)
- Dawit S Gondaria I'm a bit confused now. You asked for an elevation (topographic) map and those are colored like my draft (variations of color darkness etc). When we create maps here we try to stick to templates so they look as similar as they can. For this draft I really didn't exactly use the colors in this Maps template but used the color scale which is in my source, maps for free. This is a free map that I can use in contrast to researchgate which I can't copy from, just use it as information.
- The map at researchgate has, for me, an unusual color scale to be an elevation map, that's why I didn't use it. Also the draft I made is a more soft kind of elevation map with more details and more shades to depict that an elevation change is not that hard and exact as in the researchgate map.
- From what you write now about climate regions I understand (I think) that you really don't want an elevation map in the usual way but rather a climate regions map which is based on elevations. Is this correct?
- If so, do you want exact differences (exact line not shades) between the climate regions, and then the coloring from researchgate makes more sense when depicting climate regions. --always ping me-- Goran tek-en (talk) 16:34, 5 August 2021 (UTC)
- Dawit S Gondaria I'm a bit confused now. You asked for an elevation (topographic) map and those are colored like my draft (variations of color darkness etc). When we create maps here we try to stick to templates so they look as similar as they can. For this draft I really didn't exactly use the colors in this Maps template but used the color scale which is in my source, maps for free. This is a free map that I can use in contrast to researchgate which I can't copy from, just use it as information.
- Is it possible to do the coloring like the Researchgate? Maybe i should have added additional info like the climate regions, which is defined by elevation? 31% of the area is a Hot Zone(Kola) elevation 1500 or less meters. 44% of the area is a Warm Zone(Woyina Dega) elevation 1500-2500 meters. 25% of the area is a Cold Zone(Dega) with elevation above 2500 meters. See page 324 [1] Thanks again Dawit S Gondaria (talk) 03:18, 5 August 2021 (UTC)
- @Goran tek-en: I'm so sorry for the confusion maybe the climate region info was too much. I'm looking for a Topographic map, but that also visually distinguish better the areas 1500 m and below from the areas 1500 m -2500 m & Above 2500 m for the following reasons.
- In the future it would be easier to make a climate region maps and more based on these elevations, and also for future maps for the separate subdivisions articles. So basically it's a foundational map, so that other maps could be based on it in the future. The research gate map better distinguish these different areas, so that's why i was looking for something similar.
- Other future maps could be Agricultural maps which differ for each climate region, or the prevalance of Malaria, which is prevalant in the hot zones(1500m) below in some months, and absent in temperate higher elevations. That's why the the area 1500 m below should visually be more distinct, as does 1500m-2500m from the areas above 2500m.
- @Goran tek-en: I'm so sorry for the confusion maybe the climate region info was too much. I'm looking for a Topographic map, but that also visually distinguish better the areas 1500 m and below from the areas 1500 m -2500 m & Above 2500 m for the following reasons.
- You did a great job on the subdivision lines & the lake though! Maybe Maps template colors can help better distinguish the elevations? Hope this clarifies, apologies for the confusion Dawit S Gondaria (talk) 17:49, 5 August 2021 (UTC)
- Dawit S Gondaria I just wanted you to know I haven't forgotten this. I have tried different variations of the topographic map I created but I can't get anything which would fill your needs. So I have to try something different and I think I have one idea how to do this. It will take some more time but I am working on it, will ping you later on. --always ping me-- Goran tek-en (talk) 09:06, 10 August 2021 (UTC)
- You did a great job on the subdivision lines & the lake though! Maybe Maps template colors can help better distinguish the elevations? Hope this clarifies, apologies for the confusion Dawit S Gondaria (talk) 17:49, 5 August 2021 (UTC)
- Goran tek-en It's not an easy map, so thank you very much for your attempt, i appreciate it. Dawit S Gondaria (talk) 15:46, 12 August 2021 (UTC)
Dawit S Gondaria So, this is a mixture of the researchgate map and the topographic map and I show you with two different coloring schemes.
- Map template coloring.
- Researchgate coloring. --always ping me-- Goran tek-en (talk) 18:14, 14 August 2021 (UTC)
- @Goran tek-en Thanks a lot, You should be given a star for this! Do i have to pick one or are you uploading both to commons? Dawit S Gondaria (talk) 10:17, 16 August 2021 (UTC)
- Dawit S Gondaria If you want I can upload both but I will need the following for each file;
- Name of the file
- Description (/language)
- Captions/s (/language)
- Category/ies at commons
- to be able to upload it at commons. If you don'y know about Captions read here. --always ping me-- Goran tek-en (talk) 18:05, 16 August 2021 (UTC)
- Dawit S Gondaria If you want I can upload both but I will need the following for each file;
- @Goran tek-en Thanks a lot, You should be given a star for this! Do i have to pick one or are you uploading both to commons? Dawit S Gondaria (talk) 10:17, 16 August 2021 (UTC)
- @Goran tek-en That would be great,
- Names for the research gate map: Amhara elevation map
- Description: Elevation map of the Amhara Region in Ethiopia and subdivisions.
- Captions: Amhara Elevation map (??)
- Categories: https://commons.wikimedia.org/wiki/Category:Amhara_Region and then maybe a subcategorie: Maps
- Name for the Map template coloring: Amhara topographic map
- Description: Same as the one above
- Captions: Same as the one above??
- Categories: Same as the one above
- Thanks Dawit S Gondaria (talk) 21:13, 18 August 2021 (UTC)
Dawit S Gondaria Now you can find them here Commons:file:Amhara topographic map.svg, Commons:file:Amhara topographic map.svg. If you are happy with this please put the code {{re.solved|~~~~}} (without the ".") on this request so it can be archived, thanks. ![]() Done --always ping me-- Goran tek-en (talk) 15:57, 19 August 2021 (UTC)
Done --always ping me-- Goran tek-en (talk) 15:57, 19 August 2021 (UTC)
Awesome thanks a lot! @Goran tek-en Dawit S Gondaria (talk) 18:34, 20 August 2021 (UTC) {{resolved}}
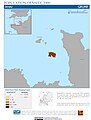
Request: map of the diocese of Morombe
{{resolved}}
-
 Unlabelled map
 -
 Example of desired result
 -
 The Diocese of Morombe
 -
 Blank map
 -
 Vector version


- Article(s)
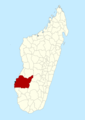
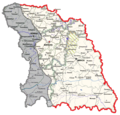
- Roman Catholic Diocese of Morombe
- Request
- The diocese of Morombe extends over four of the districts of Madagascar: Manja, Beroroha, Morombe, and Ankazoabo. Please make a map with these four districts coloured in. For reference, see Toliara Province § Administrative divisions or this labelled map of Madagascar (hover to see district names). Here are two (presumably non-free) diocesan maps: [1][2].
- Also, it might be nice to place a marker on the city Morombe, corresponding to the Cathedral of the Sacred Heart of Jesus / Cathédrale du Sacré-Cœur de Jésus (Map). gnu57 14:08, 22 August 2021 (UTC)
- Discussion
I might have a go later. Shapefile for boundaries. While at it I'll make a blank map as well. —
- Had a quick go at it. Feel free to request any changes or if you want to have a go Berrely Jcw12 (talk) 03:19, 24 August 2021 (UTC)
Litbel in Europe - 27 Feb 1919

-
 Litbelrepublic, to the west areas claimed, to the east areas under Soviet control

![[1]](https://www.icmica-miic.org/wp-content/uploads/2018/10/Madagascar-MCCP.JPG)
![[2]](https://catholicdiocesemaps.neocities.org/maps/madagascarcomoros.png)
- Article(s)
- Socialist Soviet Republic of Lithuania and Belorussia
- Request
- I'd like a Europe map with the Litbel republic highlighted, marking areas under Soviet control as of Feb 27, 1919 when the republic was established and in another shade the areas claimed by the republic but outside of its control (see File:SSR LiB as of February 27, 1919.png) -- Soman (talk) 11:42, 14 July 2021 (UTC)
- Discussion
-
- I created File:Litbel in Europe 27 II 1919.png, but it's not very good --Soman (talk) 15:31, 17 July 2021 (UTC)