Source: Wikipedia, the free encyclopedia.
1977 UK local government election
1977 Devon County Council election|
|
|
|
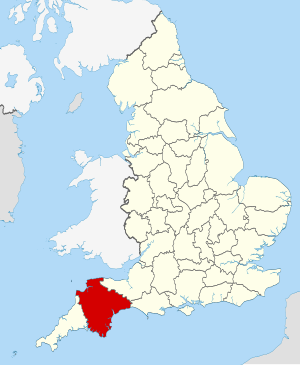 The County of Devon within England |
|
Elections to Independents were elected, down from eleven.
[1]
Election result
Result of Devon County Council election, 1977[1]
| Party
|
Seats
|
Gains
|
Losses
|
Net gain/loss
|
Seats %
|
Votes %
|
Votes
|
+/−
|
|
|
Conservative
|
85
|
28
|
0
|
+28
|
86.7
|
|
|
|
|
|
Independent
|
8
|
0
|
3
|
-3
|
8.2
|
|
|
|
|
|
Labour
|
3
|
0
|
17
|
-17
|
3.1
|
|
|
|
|
|
Liberal
|
2
|
0
|
8
|
-8
|
2.0
|
|
|
|
References
- ^ a b 'Conservatives triumph in Greater London and metropolitan counties' in The Times of London, issue 59997 dated 7 May 1977, p. 3


