
Adur District Council elections
Half of
wards.[1]
Council elections
- 1973 Adur District Council election
- 1976 Adur District Council election
- 1979 Adur District Council election (New ward boundaries)[2]
- 1980 Adur District Council election
- 1982 Adur District Council election
- 1983 Adur District Council election
- 1984 Adur District Council election
- 1986 Adur District Council election (District boundary changes took place but the number of seats remained the same)[3]
- 1987 Adur District Council election
- 1988 Adur District Council election
- 1990 Adur District Council election
- 1991 Adur District Council election
- 1992 Adur District Council election
- 1994 Adur District Council election (District boundary changes took place but the number of seats remained the same)[4]
- 1995 Adur District Council election
- 1996 Adur District Council election
- 1998 Adur District Council election
- 1999 Adur District Council election
- 2000 Adur District Council election
- 2002 Adur District Council election
- 2003 Adur District Council election
- 2004 Adur District Council election (New ward boundaries reduced the number of seats by 10)[5][6]
- 2006 Adur District Council election
- 2008 Adur District Council election
- 2010 Adur District Council election
- 2012 Adur District Council election
- 2014 Adur District Council election
- 2016 Adur District Council election
- 2018 Adur District Council election
- 2021 Adur District Council election
- 2022 Adur District Council election
District result maps
-
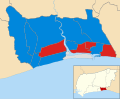
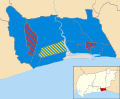 2004 results map
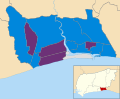
 -
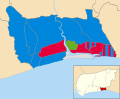
 2006 results map
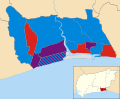
 -
 2008 results map
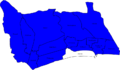
 -
 2010 results map
 -
 2012 results map
 -
 2014 results map
 -
 2016 results map
 -
 2018 results map
 -
 2021 results map
 -
 2022 results map


By-election results
1994-1998
| Party | Candidate | Votes | % | ±% | |
|---|---|---|---|---|---|
| Liberal Democrats | 967 | 37.5 | -2.4 | ||
| Labour | 821 | 31.8 | -14.9 | ||
| Conservative | 790 | 30.6 | +17.2 | ||
| Majority | 146 | 5.7 | |||
| Turnout | 2,578 | ||||
| Liberal Democrats hold | Swing | ||||
| Party | Candidate | Votes | % | ±% | |
|---|---|---|---|---|---|
| Liberal Democrats | 1,066 | 38.3 | -20.5 | ||
| Conservative | 1,062 | 38.2 | +15.5 | ||
| Labour | 652 | 23.5 | +4.9 | ||
| Majority | 4 | 0.1 | |||
| Turnout | 2,780 | ||||
| Liberal Democrats hold | Swing | ||||
| Party | Candidate | Votes | % | ±% | |
|---|---|---|---|---|---|
| Conservative | 1,192 | 39.3 | +7.6 | ||
| Liberal Democrats | 924 | 30.5 | -7.2 | ||
| Labour | 916 | 30.2 | -0.4 | ||
| Majority | 268 | 8.8 | |||
| Turnout | 3,032 | ||||
| Conservative gain from Liberal Democrats | Swing | ||||
1998-2002
| Party | Candidate | Votes | % | ±% | |
|---|---|---|---|---|---|
| Conservative | 425 | 35.6 | -4.5 | ||
| Liberal Democrats | 423 | 35.4 | -10.1 | ||
| Labour | 346 | 29.0 | +14.7 | ||
| Majority | 2 | 0.2 | |||
| Turnout | 1,194 | ||||
| Conservative gain from Liberal Democrats | Swing | ||||
| Party | Candidate | Votes | % | ±% | |
|---|---|---|---|---|---|
| Conservative | 738 | 50.3 | +10.4 | ||
| Labour | 589 | 40.2 | -4.7 | ||
| Liberal Democrats | 139 | 9.5 | -5.7 | ||
| Majority | 149 | 10.1 | |||
| Turnout | 1,466 | 34.6 | |||
| Conservative gain from Labour | Swing | ||||
| Party | Candidate | Votes | % | ±% | |
|---|---|---|---|---|---|
| Conservative | Angela Mills | 886 | 41.9 | +3.1 | |
| Liberal Democrats | Shirely Rance | 802 | 38.0 | -10.9 | |
| Labour | Ronald Horne | 425 | 21.1 | -7.8 | |
| Majority | 84 | 3.9 | |||
| Turnout | 2,113 | 64.0 | |||
| Conservative gain from Liberal Democrats | Swing | ||||
| Party | Candidate | Votes | % | ±% | |
|---|---|---|---|---|---|
| Conservative | Andrew McGregor | 761 | 40.0 | -1.5 | |
| Liberal Democrats | Barrie Marler | 617 | 32.4 | +2.7 | |
| Labour | Jeanette White | 525 | 27.6 | -1.2 | |
| Majority | 144 | 7.6 | |||
| Turnout | 1,903 | 60.7 | |||
| Conservative gain from Liberal Democrats | Swing | ||||
| Party | Candidate | Votes | % | ±% | |
|---|---|---|---|---|---|
| Conservative | Iris Hayward | 895 | 38.9 | -0.6 | |
| Liberal Democrats | Anthony Stuart | 720 | 31.3 | -1.3 | |
| Labour | Teana Ashley | 686 | 29.8 | +2.0 | |
| Majority | 175 | 7.6 | |||
| Turnout | 2,301 | 61.1 | |||
| Conservative gain from Labour | Swing | ||||
2002-2006
| Party | Candidate | Votes | % | ±% | |
|---|---|---|---|---|---|
| Conservative | Sara Hall | 368 | 50.5 | -5.9 | |
| Liberal Democrats | Roy Gibson | 213 | 29.2 | +29.2 | |
| Labour | Ann Bridges | 148 | 20.3 | -12.4 | |
| Majority | 155 | 21.3 | |||
| Turnout | 729 | 18.8 | |||
| Conservative hold | Swing | ||||
| Party | Candidate | Votes | % | ±% | |
|---|---|---|---|---|---|
Independent
|
Keith Fayers-Morrisey | 1,190 | 62.3 | ||
| Liberal Democrats | Doris Martin | 404 | 21.2 | ||
| Labour | Daniel Yates | 316 | 16.5 | ||
| Majority | 786 | 41.1 | |||
| Turnout | 1,910 | 64.0 | |||
Independent hold
|
Swing | ||||
2006-2010
| Party | Candidate | Votes | % | ±% | |
|---|---|---|---|---|---|
| Conservative | Angus Dunn | 445 | 59.1 | -0.2 | |
| Liberal Democrats | Clive Connor | 184 | 24.4 | +2.7 | |
| Labour | Barry Thompson | 124 | 16.5 | -2.5 | |
| Majority | 261 | 34.7 | |||
| Turnout | 753 | 22.0 | |||
| Conservative hold | Swing | ||||
2010-2014
| Party | Candidate | Votes | % | ±% | |
|---|---|---|---|---|---|
| Conservative | Nicholas Pigott | 288 | 39.6 | -15.6 | |
| Labour | Barry Mear | 282 | 38.8 | +13.6 | |
| UKIP | David Bamber | 91 | 12.5 | +12.5 | |
| Green | Jennie Tindall | 35 | 4.8 | +4.8 | |
| Liberal Democrats | Cyril Cannings | 31 | 4.3 | -15.3 | |
| Majority | 6 | 0.8 | -29.2 | ||
| Turnout | 730 | 21.4 | -9.6 | ||
| Conservative hold | Swing | -14.6 | |||
| Party | Candidate | Votes | % | ±% | |
|---|---|---|---|---|---|
| UKIP | Paul Graysmark | 354 | 39.9 | +24.8 | |
| Labour | Andy Bray | 254 | 28.6 | -8.5 | |
| Conservative | Vicky Parkin | 228 | 25.7 | -12.3 | |
| Liberal Democrats | Cyril Cannings | 51 | 5.7 | -4.1 | |
| Majority | 100 | 11.3 | |||
| Turnout | 887 | ||||
| UKIP gain from Conservative | Swing | ||||
Paul Graysmark was elected in 2012 for the Conservatives; he resigned to seek re-election as a UKIP candidate.
2014-2018
| Party | Candidate | Votes | % | ±% | |
|---|---|---|---|---|---|
| Conservative | Stephen Chipp | 340 | 38.4 | +1.3 | |
| Labour | Irene Reed | 223 | 25.2 | +2.6 | |
| UKIP | Jenny Greig | 216 | 24.4 | +3.3 | |
| Green | Jennie Tindall | 106 | 12.0 | -0.7 | |
| Majority | 117 | 13.2 | |||
| Turnout | 885 | ||||
| Conservative hold | Swing | ||||
| Party | Candidate | Votes | % | ±% | |
|---|---|---|---|---|---|
| Labour | Lee Cowen | 490 | 49.3 | +29.7 | |
| Conservative | Jack Howard | 384 | 38.6 | +16.0 | |
| Liberal Democrats | Doris Martin | 89 | 9.0 | -6.5 | |
| Green | Paul Hendy | 31 | 3.1 | +3.1 | |
| Majority | 106 | 10.7 | |||
| Turnout | 994 | ||||
| Labour gain from UKIP | Swing | ||||
2018-2022
| Party | Candidate | Votes | % | ±% | |
|---|---|---|---|---|---|
| Labour | Debs Stainforth | 448 | 45.9 | +4.1 | |
| Green | Andrew Bradbury | 395 | 40.5 | +34.9 | |
| Conservative | Tony Nicklen | 132 | 13.5 | -27.2 | |
| Majority | 53 | 5.4 | |||
| Turnout | 975 | ||||
| Labour gain from UKIP | Swing | ||||
| Party | Candidate | Votes | % | ±% | |
|---|---|---|---|---|---|
| Conservative | Leila Williams | 414 | 56.2 | ||
| Green | Russell Whiting | 175 | 23.7 | ||
| Labour | Rebecca Allinson | 148 | 20.1 | ||
| Majority | 239 | 32.4 | |||
| Turnout | 737 | ||||
| Conservative hold | Swing | ||||
References
- ^ "Your councillors". Adur District Council. Retrieved 21 October 2009.
- ^ The District of Adur (Electoral Arrangements) Order 1978
- ^ The Adur, Arun and Worthing (Areas) Order 1985
- ^ legislation.gov.uk - The East Sussex, West Sussex and Kent (County Boundaries) Order 1992. Retrieved on 5 November 2015.
- ^ "Adur". * BBC News Online. Retrieved 3 May 2008.
- ^ legislation.gov.uk - The District of Adur (Electoral Changes) Order 2002. Retrieved on 4 October 2015.
- ^ "Marine ward by-election" (PDF). Adur District Council. Retrieved 26 July 2011.
- guardian.co.uk. 15 September 2006. Retrieved 21 October 2009.
- ^ "Declaration of Result: Cokeham Ward By Election" (PDF). Adur District Council. 18 October 2011. Retrieved 19 October 2011.
- ^ "Local Elections Archive Project — Southlands Ward". www.andrewteale.me.uk. Retrieved 21 April 2022.
- ^ "Local Elections Archive Project — St Mary's Ward". www.andrewteale.me.uk. Retrieved 21 April 2022.
- ^ "Local Elections Archive Project — Mash Barn Ward". www.andrewteale.me.uk. Retrieved 21 April 2022.
- ^ "Local Elections Archive Project — Southlands Ward". www.andrewteale.me.uk. Retrieved 21 April 2022.
- ^ "Local Elections Archive Project — Hillside Ward". www.andrewteale.me.uk. Retrieved 21 April 2022.
- By-election results Archived 29 March 2010 at the Wayback Machine
External links
| West Sussex CC | |
|---|---|
| Adur | |
| Arun | |
| Chichester | |
| Crawley | |
| Horsham | |
| Mid Sussex | |
| Worthing | |
| |