
Encinal, Texas
Encinal, Texas | ||
|---|---|---|
FIPS code 48-24240[3] | | |
| GNIS feature ID | 2410439[2] | |
| Website | https://www.cityofencinal.com/ | |
Encinal (
Railroad officials named the town for the Spanish word for oak grove. The population peaked in 1937 at eight hundred residents.
History
Encinal may be named for the Spanish word for a
Geography
Encinal is located at 28°2′28″N 99°21′17″W / 28.04111°N 99.35472°W.[2]
According to the United States Census Bureau, the city has a total area of 0.4 square miles (1.0 km2), all land.
Climate
The climate in this area is characterized by hot, humid summers and generally mild to cool winters. According to the
| Climate data for Encinal, Texas (1991–2020 normals, extremes 1907–2020) | |||||||||||||
|---|---|---|---|---|---|---|---|---|---|---|---|---|---|
| Month | Jan | Feb | Mar | Apr | May | Jun | Jul | Aug | Sep | Oct | Nov | Dec | Year |
| Record high °F (°C) | 96 (36) |
101 (38) |
105 (41) |
110 (43) |
115 (46) |
116 (47) |
114 (46) |
112 (44) |
111 (44) |
105 (41) |
98 (37) |
98 (37) |
116 (47) |
| Mean daily maximum °F (°C) | 67.6 (19.8) |
72.4 (22.4) |
79.1 (26.2) |
86.6 (30.3) |
92.4 (33.6) |
97.9 (36.6) |
98.4 (36.9) |
99.7 (37.6) |
92.6 (33.7) |
86.1 (30.1) |
76.0 (24.4) |
67.6 (19.8) |
84.7 (29.3) |
| Daily mean °F (°C) | 55.2 (12.9) |
59.2 (15.1) |
65.2 (18.4) |
72.6 (22.6) |
79.3 (26.3) |
84.8 (29.3) |
85.7 (29.8) |
86.2 (30.1) |
81.0 (27.2) |
73.0 (22.8) |
63.5 (17.5) |
55.3 (12.9) |
71.8 (22.1) |
| Mean daily minimum °F (°C) | 42.9 (6.1) |
46.0 (7.8) |
51.3 (10.7) |
58.5 (14.7) |
66.3 (19.1) |
71.7 (22.1) |
73.0 (22.8) |
72.8 (22.7) |
69.5 (20.8) |
60.0 (15.6) |
51.0 (10.6) |
42.9 (6.1) |
58.8 (14.9) |
| Record low °F (°C) | 8 (−13) |
15 (−9) |
23 (−5) |
29 (−2) |
40 (4) |
51 (11) |
57 (14) |
60 (16) |
44 (7) |
31 (−1) |
21 (−6) |
11 (−12) |
8 (−13) |
| Average precipitation inches (mm) | 1.03 (26) |
1.08 (27) |
2.24 (57) |
1.93 (49) |
2.63 (67) |
2.38 (60) |
2.66 (68) |
1.63 (41) |
3.18 (81) |
2.45 (62) |
1.20 (30) |
1.13 (29) |
23.54 (598) |
| Average snowfall inches (cm) | 0.0 (0.0) |
0.0 (0.0) |
0.0 (0.0) |
0.0 (0.0) |
0.0 (0.0) |
0.0 (0.0) |
0.0 (0.0) |
0.0 (0.0) |
0.0 (0.0) |
0.0 (0.0) |
0.0 (0.0) |
0.3 (0.76) |
0.3 (0.76) |
| Average precipitation days (≥ 0.01 in) | 2.6 | 2.4 | 2.8 | 2.4 | 4.1 | 3.3 | 3.3 | 2.3 | 4.8 | 2.5 | 2.3 | 1.7 | 34.5 |
| Average snowy days (≥ 0.1 in) | 0.0 | 0.0 | 0.0 | 0.0 | 0.0 | 0.0 | 0.0 | 0.0 | 0.0 | 0.0 | 0.0 | 0.1 | 0.1 |
| Source: NOAA[6][7] | |||||||||||||
Transportation
Highways
- Interstate Highway 35, exit 38, Runs directly through town to the east.
 Texas State Highway 44. Runs through town, Ends at US 83 far west of town.
 US 83. Bypasses town to the Far West.
Air travel
Demographics
| Census | Pop. | Note | %± |
|---|---|---|---|
| 1890 | 562 | — | |
| 1980 | 704 | — | |
| 1990 | 620 | −11.9% | |
| 2000 | 629 | 1.5% | |
| 2010 | 559 | −11.1% | |
| 2020 | 540 | −3.4% | |
| U.S. Decennial Census[8] | |||
2020 census
| Race | Number | Percentage |
|---|---|---|
White (NH)
|
29 | 5.37% |
Alaska Native (NH)
|
1 | 0.19% |
| Mixed/Multi-Racial (NH) | 4 | 0.74% |
| Hispanic or Latino | 506 | 93.7% |
| Total | 540 |
As of the 2020 United States census, there were 540 people, 380 households, and 331 families residing in the city.
2000 census
As of the census
There were 215 households, out of which 40.5% had children under the age of 18 living with them, 51.2% were married couples living together, 17.7% had a female householder with no husband present, and 25.6% were non-families. 22.3% of all households were made up of individuals, and 12.1% had someone living alone who was 65 years of age or older. The average household size was 2.93 and the average family size was 3.50.
In the city, the population was spread out, with 31.8% under the age of 18, 9.9% from 18 to 24, 24.6% from 25 to 44, 19.7% from 45 to 64, and 14.0% who were 65 years of age or older. The median age was 31 years. For every 100 females, there were 101.0 males. For every 100 females age 18 and over, there were 102.4 males.
The median income for a household in the city was $14,853, and the median income for a family was $18,125. Males had a median income of $18,250 versus $13,750 for females. The per capita income for the city was $6,928. About 37.2% of families and 38.1% of the population were below the poverty line, including 42.9% of those under age 18 and 30.2% of those age 65 or over.
Education
- Encinal is within the Cotulla Independent School District.
Notable people
- Rodney Lewis, CEO of Lewis Energy, has a ranch in Encinal[12]
- George Strait, country music artist lives on his 8,000+ acre ranch near Encinal
Gallery
-
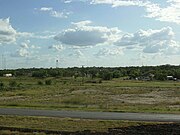 A glimpse of Encinal from Interstate 35.
 -
 Cactus around Encinal & La Salle County
 -
 Veteran's Monument in Encinal


References
- ^ "2019 U.S. Gazetteer Files". United States Census Bureau. Retrieved August 7, 2020.
- ^ a b c d U.S. Geological Survey Geographic Names Information System: Encinal, Texas
- ^ a b "U.S. Census website". United States Census Bureau. Retrieved January 31, 2008.
- ^ Encinal, Texas. TexasEscapes.com.
- ^ Climate Summary for Encinal, Texas
- ^ "NOWData - NOAA Online Weather Data". National Oceanic and Atmospheric Administration. Retrieved February 6, 2024.
- ^ "Summary of Monthly Normals 1991-2020". National Oceanic and Atmospheric Administration. Retrieved February 6, 2024.
- ^ "Census of Population and Housing". Census.gov. Retrieved June 4, 2015.
- ^ "Explore Census Data". data.census.gov. Retrieved May 20, 2022.
- ^ https://www.census.gov/ [not specific enough to verify]
- ^ "About the Hispanic Population and its Origin". www.census.gov. Retrieved May 18, 2022.
- ^ Helman, Christopher; Jesse Bogan (August 13, 2008), "A Wildcatter in Love with Warbirds", Forbes Magazine
External links
- Encinal, Texas from the Handbook of Texas Online
Municipalities and communities of La Salle County, Texas, United States | ||
|---|---|---|
| Cities |  | |
| CDP | ||
| Other communities | ||
| Ghost town | ||
| ||