
File:2021 North Indian Ocean cyclone season summary.png

Size of this preview: 800 × 494 pixels. Other resolutions: 320 × 198 pixels | 640 × 396 pixels | 1,024 × 633 pixels | 1,280 × 791 pixels | 2,560 × 1,582 pixels | 4,000 × 2,472 pixels.
Original file (4,000 × 2,472 pixels, file size: 10.13 MB, MIME type: image/png)
| This is a file from the Wikimedia Commons. Information from its description page there is shown below. Commons is a freely licensed media file repository. You can help. |
Summary
| Description |
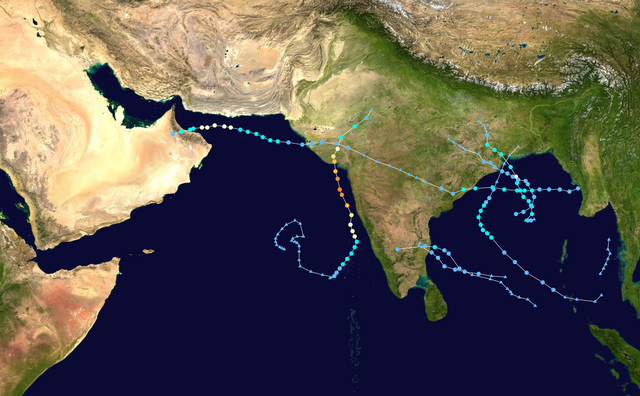
English: This map shows the tracks of all tropical cyclones in the 2021 North Indian Ocean cyclone season. The points show the location of each storm at 6-hour intervals. The colour represents the storm's maximum sustained wind speeds as classified in the Saffir-Simpson Hurricane Scale (see below), and the shape of the data points represent the type of the storm. Map generation parameters: --res 4000 --extra 1 --dots 0.2 --lines 0.04 --xmin 40 --xmax 100 --ymin 0 --ymax 35
Tropical depression (≤38 mph, ≤62 km/h)
Tropical storm (39–73 mph, 63–118 km/h)
Category 1 (74–95 mph, 119–153 km/h)
Category 2 (96–110 mph, 154–177 km/h)
Category 3 (111–129 mph, 178–208 km/h)
Category 4 (130–156 mph, 209–251 km/h)
Category 5 (≥157 mph, ≥252 km/h)
Unknown
Storm type |
| Source | Created using Wikipedia:WikiProject Tropical cyclones/Tracks. The background image is from NASA [1]. The tracking data is from the Joint Typhoon Warning Center's best track database |
| Author | Meow |
| This work has been released into the public domain by its author, Meow. This applies worldwide. In some countries this may not be legally possible; if so: Meow grants anyone the right to use this work for any purpose, without any conditions, unless such conditions are required by law. |
File history
Click on a date/time to view the file as it appeared at that time.
| Date/Time | Thumbnail | Dimensions | User | Comment | |
|---|---|---|---|---|---|
| current | 23:07, 5 August 2022 | | 4,000 × 2,472 (10.13 MB) | Supportstorm | Updated with JTWC/IMD best track data |
| 02:39, 6 December 2021 |  | 4,000 × 2,472 (9.94 MB) | Meow | 12-06 00Z (Jawad) | |
| 08:15, 20 November 2021 |  | 4,000 × 2,472 (9.91 MB) | Meow | 11-19 12Z (BOB 06) | |
| 04:45, 13 November 2021 |  | 4,000 × 2,472 (9.9 MB) | Meow | 11-11 18Z (ARB 03 and BOB 05) | |
| 02:28, 5 October 2021 |  | 4,000 × 2,472 (9.87 MB) | Meow | 10-04 06Z (Gulab-Shaheen) | |
| 03:39, 15 September 2021 |  | 4,000 × 2,472 (9.85 MB) | Meow | 09-14 18Z (BOB 03) | |
| 04:31, 28 May 2021 |  | 4,000 × 2,472 (9.85 MB) | Meow | 05-27 18Z (Yaas) | |
| 11:09, 20 May 2021 |  | 4,000 × 2,472 (9.84 MB) | Meow | 05-19 06Z (Tauktae) | |
| 07:15, 4 April 2021 |  | 4,000 × 2,472 (9.82 MB) | Meow | {{Hurricane season auto track map|start=2021-04-02|end=|source=JTWC|type=cyclone|basin=North Indian Ocean|year=2020|comments= Map generation parameters: <tt>--res 4000 --extra 1 --dots 0.2 --lines 0.04 --xmin 40 --xmax 100 --ymin 0 --ymax 35</tt>|author=Meow}} |
File usage
The following pages on the English Wikipedia use this file (pages on other projects are not listed):
Global file usage
The following other wikis use this file:
- Usage on bn.wikipedia.org
- Usage on de.wikipedia.org
- Usage on es.wikipedia.org
- Usage on ko.wikipedia.org
- Usage on pt.wikipedia.org
- Usage on th.wikipedia.org
- Usage on vi.wikipedia.org
- Usage on www.wikidata.org
- Usage on zh.wikipedia.org