
Rangsdorf
Rangsdorf | |
|---|---|
 Coat of arms | |
Location of Rangsdorf within Teltow-Fläming district 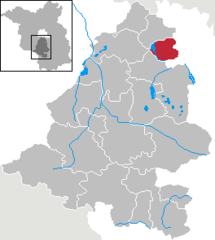 | |
Ortsteile | |
| Government | |
| • Mayor (2019–27) | Klaus Rocher[1] (FDP) |
| Area | |
| • Total | 33.72 km2 (13.02 sq mi) |
| Elevation | 36 m (118 ft) |
| Population (2022-12-31)[2] | |
| • Total | 11,695 |
| • Density | 350/km2 (900/sq mi) |
| Time zone | UTC+01:00 (CET) |
| • Summer (DST) | UTC+02:00 (CEST) |
| Postal codes | 15834 |
| Dialling codes | 033708 |
| Vehicle registration | TF |
| Website | www.rangsdorf.de |
Rangsdorf is a
Wolfsschanze
.
Demography
-
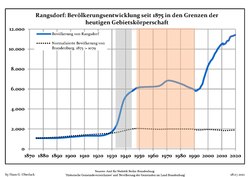 Development of Population since 1875 within Current Boundaries (Blue Line: Population; Dotted Line: Comparison to Population Development of Brandenburg state; Grey Background: Time of National Socialist rule; Red Background: Time of Communist rule)
 -
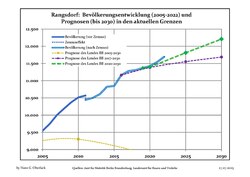 Recent Population Development and Projections (Population Development before Census 2011 (blue line); Recent Population Development according to the Census in Germany in 2011 (blue bordered line); Official projections for 2005-2030 (yellow line); for 2020-2030 (green line); for 2017-2030 (scarlet line)


|
|
|
References
- ^ Landkreis Teltow-Fläming Wahl der Bürgermeisterin / des Bürgermeisters, accessed 4 July 2021.
- Amt für Statistik Berlin-Brandenburg(in German). June 2023.
- ^ Detailed data sources are to be found in the Wikimedia Commons.Population Projection Brandenburg at Wikimedia Commons
Towns and municipalities in Teltow-Fläming | ||
|---|---|---|
 | ||
| International | |
|---|---|
| National | |
| Geographic | |
This Brandenburg location article is a stub. You can help Wikipedia by expanding it. |