
Verfeil, Haute-Garonne
Verfeil | |
|---|---|
_aerial_east_exposure.jpg) An aerial view of Verfeil | |
.svg) Coat of arms | |
Location of Verfeil  | |
 Verfeil  Verfeil | |
| Coordinates: 43°39′30″N 1°39′42″E / 43.6583°N 1.6617°E | |
| Country | France |
| Region | Occitania |
| Department | Haute-Garonne |
| Arrondissement | Toulouse |
| Canton | Pechbonnieu |
| Intercommunality | Coteaux du Girou |
| Government | |
| • Mayor (2020–2026) | Patrick Plicque[1] |
| Area 1 | 41.23 km2 (15.92 sq mi) |
| Population (2021)[2] | 3,797 |
| • Density | 92/km2 (240/sq mi) |
| Time zone | UTC+01:00 (CET) |
| • Summer (DST) | UTC+02:00 (CEST) |
| INSEE/Postal code | 31573 /31590 |
| Elevation | 146–273 m (479–896 ft) (avg. 225 m or 738 ft) |
| 1 French Land Register data, which excludes lakes, ponds, glaciers > 1 km2 (0.386 sq mi or 247 acres) and river estuaries. | |
Verfeil (French pronunciation: [vɛʁfɛj]; Occitan: Vrudfuèlh) is a commune in the Haute-Garonne department in southwestern France.
History
It was an important centre of Catharism from about 1140 to the mid 13th century. Bernard of Clairvaux preached against heresy at Verfeil in 1145. Sent away without a proper hearing by the seigneurs, he is said to have cursed the town with the words Viridefolium, desiccet te Deus! ("Verfeil, may God dry you up!") Izarn Neblat, one of those seigneurs, was said by Guillaume de Puylaurens to have lived in his old age in poverty at Toulouse as a result of this curse; the town's recovery was dated by the faithful to the period of the Albigensian Crusade, when Simon de Montfort, 5th Earl of Leicester gave it to bishop Foulques de Toulouse.[3]
An important Catholic-Cathar debate was held at Verfeil in 1206. The Catholic side was led by
Population
|
| |||||||||||||||||||||||||||||||||||||||||||||||||||||||||||||||||||||||||||||||||||||||||||||||||||||||||||||||||||||
| Source: EHESS[5] and INSEE (1968-2017)[6] | ||||||||||||||||||||||||||||||||||||||||||||||||||||||||||||||||||||||||||||||||||||||||||||||||||||||||||||||||||||||
Monuments
-
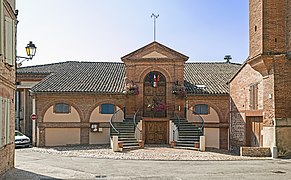 The town hall
 -
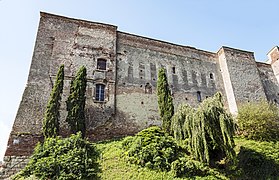 The castle
 -
 The Vaureze's Gate
 -
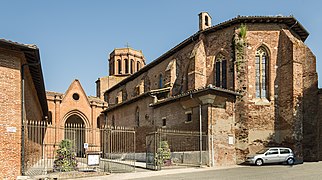 The church "Saint Blaise"
 -
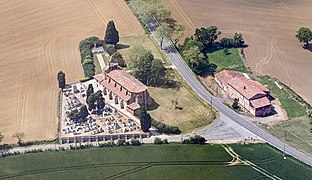 The church "Saint-Sernin-of-Rais"
 -
 War Memorial
_-_La_mairie.jpg)
_-_Le_ch%C3%A2teau.jpg)
_-_La_porte_Vaureze.jpg)
_-_L%E2%80%99%C3%A9glise_Saint-Blaise.jpg)
_-_%C3%A9glise_Saint-Sernin-des-Rais-_vue_a%C3%A9rienne.jpg)
_-_Monument_aux_morts.jpg)
See also
References
- ^ "Répertoire national des élus: les maires" (in French). data.gouv.fr, Plateforme ouverte des données publiques françaises. 13 September 2022.
- ^ "Populations légales 2021". The National Institute of Statistics and Economic Studies. 28 December 2023.
- ISBN 2-910352-06-4)
{{citation}}:|given=has generic name (help)CS1 maint: multiple names: authors list (link - ^ ib., pp. 52-55.
- ^ Des villages de Cassini aux communes d'aujourd'hui: Commune data sheet Verfeil, EHESS (in French).
- ^ Population en historique depuis 1968, INSEE
| Authority control databases: National |
|---|
This Haute-Garonne geographical article is a stub. You can help Wikipedia by expanding it. |