
Cumbria County Council elections
wards for the last council before abolition in 2023.[1]
Political control
Political control of the council from 1974 until its abolition in 2023 was held by the following parties:[2]
| Party in control | Years | |
|---|---|---|
| No overall control | 1974–1977 | |
| Conservative | 1977–1981 | |
| Labour | 1981–1985 | |
| No overall control | 1985–1997 | |
| Labour | 1997–2001 | |
| No overall control | 2001–2023 | |
Leadership
The leaders of the council from 1986 until its abolition in 2023 were:[3]
| Councillor | Party | From | To | |
|---|---|---|---|---|
| Bill Minto[4] | Labour | 1986 | 9 May 2000 | |
| Stewart Young | Labour | 9 May 2000 | 21 Jun 2001 | |
| Rex Toft[5] | Conservative | 21 Jun 2001 | 16 Sep 2004 | |
| Tim Stoddard | Conservative | 16 Sep 2004 | 10 Sep 2008 | |
| Stewart Young | Labour | 10 Sep 2008 | 18 Jun 2009 | |
| Jim Buchanan[6] | Conservative | 18 Jun 2009 | 8 Apr 2010 | |
| Eddie Martin | Conservative | 22 Apr 2010 | 5 May 2013 | |
| Stewart Young | Labour | 16 May 2013 | 31 Mar 2023 | |
Council elections
- 1973 Cumbria County Council election
- 1977 Cumbria County Council election
- 1981 Cumbria County Council election (boundary changes increased the number of seats by 1)[7]
- 1985 Cumbria County Council election
- 1989 Cumbria County Council election
- 1993 Cumbria County Council election
- 1997 Cumbria County Council election
- 2001 Cumbria County Council election (boundary changes reduced the number of seats by 1)[8]
- 2005 Cumbria County Council election
- 2009 Cumbria County Council election
- 2013 Cumbria County Council election
- 2017 Cumbria County Council election
Election results
| Overall control | Conservative | Labour | Lib Dems[a] | Socialist People's | Liberal | Independent | |||||||
| 2017 | NOC | 37 | 26 | 16 | - | - | 5 | ||||||
| 2013 | NOC | 26 | 35 | 16 | - | - | 7 | ||||||
| 2009 | NOC | 38 | 24 | 16 | 1 | - | 5 | ||||||
| 2005 | NOC | 32 | 39 | 11 | - | - | 2 | ||||||
| 2001 | NOC | 33 | 40 | 10 | - | - | 1 | ||||||
| 2001 | NOC | 33 | 40 | 10 | - | - | 1 | ||||||
| 1997 | Labour | 22 | 44 | 13 | - | - | 4 | ||||||
| 1993 | NOC | 28 | 39 | 13 | - | 1 | 2 | ||||||
| 1989 | NOC | 37 | 37 | 6 | - | - | 3 | ||||||
| 1985 | NOC | 36 | 39 | 5 | - | - | 3 | ||||||
| 1981 | NOC | 35 | 42 | 3 | - | - | 3 | ||||||
| 1977 | Conservative | 52 | 23 | - | - | - | 7 | ||||||
| 1973 | NOC | 31 | 38 | 1 | - | - | 12 | ||||||
- ^ Social and Liberal Democrats in 1989, SDP–Liberal Alliance in 1985, Liberal Party in 1981, 1977, and 1973.
County result maps
-
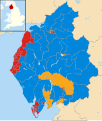 2001 results map
 -
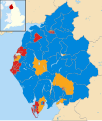 2005 results map
 -
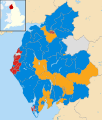 2009 results map
 -
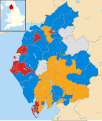 2013 results map
 -
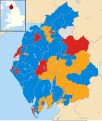 2017 results map


By-election results
1993-1997
| Party | Candidate | Votes | % | ±% | |
|---|---|---|---|---|---|
| Conservative | 616 | 41.0 | |||
| Liberal Democrats | 510 | 34.0 | |||
| Labour | 317 | 21.0 | |||
Independent
|
51 | 3.4 | |||
| Majority | 106 | 7.0 | |||
| Turnout | 1,494 | 25.0 | |||
| Conservative hold | Swing | ||||
1997-2001
| Party | Candidate | Votes | % | ±% | |
|---|---|---|---|---|---|
| Liberal Democrats | 908 | 62.6 | +11.8 | ||
| Conservative | 328 | 22.6 | -5.4 | ||
| Labour | 214 | 14.8 | -6.4 | ||
| Majority | 580 | 40.0 | |||
| Turnout | 1,450 | ||||
| Liberal Democrats hold | Swing | ||||
| Party | Candidate | Votes | % | ±% | |
|---|---|---|---|---|---|
| Conservative | 660 | 82.9 | +18.2 | ||
| Labour | 136 | 17.1 | -18.2 | ||
| Majority | 524 | 65.8 | |||
| Turnout | 796 | 17.9 | |||
| Conservative hold | Swing | ||||
| Party | Candidate | Votes | % | ±% | |
|---|---|---|---|---|---|
| Liberal Democrats | 930 | 55.7 | -0.1 | ||
| Conservative | 558 | 33.4 | -0.3 | ||
| Labour | 182 | 10.9 | +0.4 | ||
| Majority | 372 | 22.3 | |||
| Turnout | 1,670 | ||||
| Liberal Democrats hold | Swing | ||||
| Party | Candidate | Votes | % | ±% | |
|---|---|---|---|---|---|
| Labour | 332 | 45.0 | -31.4 | ||
Independent
|
255 | 34.6 | +34.6 | ||
| Conservative | 151 | 20.5 | -3.1 | ||
| Majority | 77 | 10.4 | |||
| Turnout | 738 | 20.5 | |||
| Labour hold | Swing | ||||
| Party | Candidate | Votes | % | ±% | |
|---|---|---|---|---|---|
| Conservative | 346 | 37.4 | +9.8 | ||
| Labour | 340 | 36.8 | -18.4 | ||
| Liberal Democrats | 238 | 25.8 | +8.2 | ||
| Majority | 6 | 0.6 | |||
| Turnout | 924 | ||||
| Conservative gain from Labour | Swing | ||||
2001-2005
| Party | Candidate | Votes | % | ±% | |
|---|---|---|---|---|---|
| Conservative | Isa Henderson | 797 | 41.8 | +6.3 | |
Independent
|
Bryan Metz | 787 | 41.2 | +22.0 | |
| Labour | Christopher Bagshaw | 324 | 17.0 | +7.6 | |
| Majority | 10 | 0.6 | |||
| Turnout | 1,908 | 41.0 | |||
| Conservative hold | Swing | ||||
| Party | Candidate | Votes | % | ±% | |
|---|---|---|---|---|---|
| Conservative | 1,229 | 66.2 | +6.0 | ||
| Liberal Democrats | 556 | 30.0 | -9.8 | ||
| Labour | 71 | 3.8 | +3.8 | ||
| Majority | 673 | 36.2 | |||
| Turnout | 1,856 | 36.8 | |||
| Conservative hold | Swing | ||||
| Party | Candidate | Votes | % | ±% | |
|---|---|---|---|---|---|
| Liberal Democrats | 889 | 51.1 | +41.4 | ||
| Labour | 851 | 48.9 | -26.2 | ||
| Majority | 38 | 2.2 | |||
| Turnout | 1,740 | 44.4 | |||
| Liberal Democrats gain from Labour | Swing | ||||
| Party | Candidate | Votes | % | ±% | |
|---|---|---|---|---|---|
| Labour | 645 | 57.5 | -25.5 | ||
| Liberal Democrats | 476 | 42.5 | +42.5 | ||
| Majority | 169 | 15.0 | |||
| Turnout | 1,121 | 22.0 | |||
| Labour hold | Swing | ||||
| Party | Candidate | Votes | % | ±% | |
|---|---|---|---|---|---|
Independent
|
273 | 62.8 | +62.8 | ||
| Labour | 162 | 37.2 | -17.2 | ||
| Majority | 111 | 25.6 | |||
| Turnout | 435 | 13.3 | |||
Independent gain from Labour
|
Swing | ||||
2005-2009
| Party | Candidate | Votes | % | ±% | |
|---|---|---|---|---|---|
| Labour | Joseph Holliday | 658 | 53.3 | -4.5 | |
| Conservative | John Heathcote | 430 | 34.8 | -7.4 | |
Independent
|
John Bracken | 120 | 9.7 | +9.7 | |
| Green | Lynn Bates | 26 | 2.1 | +2.1 | |
| Majority | 228 | 18.5 | |||
| Turnout | 1,234 | 32.3 | |||
| Labour hold | Swing | ||||
| Party | Candidate | Votes | % | ±% | |
|---|---|---|---|---|---|
| Conservative | Lawrence Fisher | 717 | 61.4 | +13.6 | |
| Labour | Alex Faulds | 363 | 31.1 | +2.9 | |
| BNP | David Fisher | 88 | 7.5 | +7.5 | |
| Majority | 354 | 30.3 | |||
| Turnout | 1,168 | 23.3 | |||
| Conservative hold | Swing | ||||
| Party | Candidate | Votes | % | ±% | |
|---|---|---|---|---|---|
| Liberal Democrats | Olwyn Lockley | 653 | 64.0 | +20.2 | |
| Labour | Joseph Hendry | 222 | 21.7 | -18.2 | |
| Conservative | James Bainbridge | 117 | 11.5 | -4.8 | |
| Green | Lynn Bates | 29 | 2.8 | +2.8 | |
| Majority | 431 | 42.3 | |||
| Turnout | 1,021 | 25.2 | |||
| Liberal Democrats hold | Swing | ||||
| Party | Candidate | Votes | % | ±% | |
|---|---|---|---|---|---|
| Liberal Democrats | Patricia Bell | 800 | 59.8 | +14.7 | |
| Conservative | Dawn Dixon | 380 | 28.4 | -2.2 | |
Independent
|
Keith Phillips | 123 | 9.2 | +3.6 | |
| Green | Alan Marsden | 34 | 2.5 | +2.5 | |
| Majority | 420 | 31.4 | |||
| Turnout | 1,337 | 29.7 | |||
| Liberal Democrats hold | Swing | ||||
| Party | Candidate | Votes | % | ±% | |
|---|---|---|---|---|---|
| Labour | Wendy Skillicorn | 434 | 41.7 | -24.1 | |
| BNP | Simon Nicholson | 418 | 40.1 | +40.1 | |
| Conservative | Brigid Anne Whiteside | 190 | 18.2 | +1.1 | |
| Majority | 16 | 1.5 | -47.1 | ||
| Turnout | 1,042 | 26.6 | -26.7 | ||
| Labour hold | Swing | ||||
2009-2013
| Party | Candidate | Votes | % | ±% | |
|---|---|---|---|---|---|
| Conservative | Val Tarbitt | 1,718 | 48.4 | -13.8 | |
| Liberal Democrats | Ian Highmore | 1,158 | 32.7 | +32.7 | |
| Labour | Helen Horne | 495 | 14.0 | -8.9 | |
| BNP | Tony Carvell | 175 | 4.9 | -10.0 | |
| Majority | 560 | 15.8 | |||
| Turnout | 3,546 | ||||
| Conservative hold | Swing | ||||
| Party | Candidate | Votes | % | ±% | |
|---|---|---|---|---|---|
| Conservative | Mike Johnson | 823 | 70.6 | +13.8 | |
| Green | Helen Graham | 342 | 29.4 | +29.4 | |
| Majority | 481 | 41.3 | |||
| Turnout | 1,165 | ||||
| Conservative hold | Swing | ||||
| Party | Candidate | Votes | % | ±% | |
|---|---|---|---|---|---|
| Conservative | Ronald Munby | 827 | 32.3 | +0.7 | |
| Independent | David Robinson | 650 | 25.4 | +25.4 | |
| Liberal Democrats | Martin Pugmire | 619 | 24.2 | -17.8 | |
| Labour | Brian Cope | 464 | 18.1 | +2.9 | |
| Majority | 177 | 6.9 | |||
| Turnout | 2,560 | ||||
| Conservative gain from Liberal Democrats | Swing | ||||
| Party | Candidate | Votes | % | ±% | |
|---|---|---|---|---|---|
| Labour | Willie Whalen | 407 | 40.9 | +16.9 | |
| Liberal Democrats | Olwyn Luckley | 369 | 37.1 | +2.8 | |
| Conservative | Keith Meller | 93 | 9.3 | -10.2 | |
| UKIP | Michael Owen | 72 | 7.2 | +7.2 | |
| Green | Neil Boothman | 54 | 5.4 | +5.4 | |
| Majority | 38 | 3.8 | |||
| Turnout | 995 | ||||
| Labour gain from Liberal Democrats | Swing | ||||
| Party | Candidate | Votes | % | ±% | |
|---|---|---|---|---|---|
| Liberal Democrats | John McCreesh | 1,157 | 55.7 | -16.5 | |
| Labour | Paul Braithwaite | 542 | 26.1 | +18.9 | |
| Conservative | Patrick Birchall | 268 | 12.9 | -4.5 | |
| UKIP | Malcolm Nightingale | 110 | 5.3 | +5.3 | |
| Majority | 615 | 29.6 | |||
| Turnout | 2,077 | ||||
| Liberal Democrats hold | Swing | ||||
| Party | Candidate | Votes | % | ±% | |
|---|---|---|---|---|---|
| Conservative | Jim Lister | 625 | 34.7 | -22.1 | |
| Labour | Brian Cope | 520 | 28.9 | +4.1 | |
| Independent | Bill Finlay | 390 | 21.7 | +21.7 | |
| Liberal Democrats | Phill Roberts | 206 | 11.5 | -6.9 | |
| Green | David Bober | 58 | 3.2 | +3.2 | |
| Majority | 105 | 5.8 | |||
| Turnout | 1,799 | ||||
| Conservative hold | Swing | ||||
2013-2017
| Party | Candidate | Votes | % | ±% | |
|---|---|---|---|---|---|
| Labour | Celia Tibble | 628 | 46.8 | +14.8 | |
| UKIP | Robert Hardon | 483 | 36.0 | +10.9 | |
| Conservative | Mike Davidson | 107 | 8.0 | +3.3 | |
| Independent | Tony North | 98 | 7.3 | +7.3 | |
| Liberal Democrats | Frank Hollowell | 26 | 1.9 | +1.9 | |
| Majority | 145 | 10.8 | |||
| Turnout | 1,342 | ||||
| Labour gain from Independent | Swing | ||||
| Party | Candidate | Votes | % | ±% | |
|---|---|---|---|---|---|
| Labour | Christine Bowditch | 565 | 45.8 | -20.1 | |
| Conservative | Nigel Christian | 435 | 35.3 | +1.2 | |
| UKIP | John Stayner | 234 | 19.0 | +19.0 | |
| Majority | 130 | 10.5 | |||
| Turnout | 1,234 | ||||
| Labour hold | Swing | ||||
| Party | Candidate | Votes | % | ±% | |
|---|---|---|---|---|---|
| Labour | Alan McGuckin | 389 | 37.7 | -2.8 | |
| Conservative | James Bainbridge | 245 | 23.7 | +13.1 | |
| UKIP | John Stanyer | 235 | 22.8 | +2.8 | |
| Liberal Democrats | Lawrence Jennings | 112 | 10.9 | -12.3 | |
| Green | Neil Boothman | 51 | 4.9 | +0.9 | |
| Majority | 144 | 14.0 | |||
| Turnout | 1,032 | ||||
| Labour hold | Swing | ||||
| Party | Candidate | Votes | % | ±% | |
|---|---|---|---|---|---|
| Liberal Democrats | Colin Jones | 1,061 | 51.6 | -10.5 | |
| Conservative | James Bainbridge | 810 | 39.4 | +20.7 | |
| Independent | Robert Judson | 123 | 6.0 | +6.0 | |
| Green | Gwen Harrison | 61 | 3.0 | +3.0 | |
| Majority | 251 | 12.2 | |||
| Turnout | 2,055 | ||||
| Liberal Democrats hold | Swing | ||||
| Party | Candidate | Votes | % | ±% | |
|---|---|---|---|---|---|
| Labour | Frank Cassidy | 727 | 63.4 | +2.0 | |
| UKIP | Graham Pritchard | 239 | 20.8 | +3.3 | |
| Conservative | Greg Peers | 181 | 15.8 | -5.3 | |
| Majority | 488 | 42.5 | |||
| Turnout | 1,147 | ||||
| Labour hold | Swing | ||||
| Party | Candidate | Votes | % | ±% | |
|---|---|---|---|---|---|
| Liberal Democrats | Sue Sanderson | 1,394 | 46.1 | -21.7 | |
| Conservative | Greg Peers | 1,355 | 44.8 | +12.6 | |
| Green | Gwen Harrison | 276 | 9.1 | +9.1 | |
| Majority | 39 | 1.3 | |||
| Turnout | 3,025 | ||||
| Liberal Democrats hold | Swing | ||||
| Party | Candidate | Votes | % | ±% | |
|---|---|---|---|---|---|
| Conservative | Thomas Wentworth Waites | 635 | 55.1 | +2.2 | |
| Liberal Democrats | Judith Derbyshire | 518 | 44.9 | +22.1 | |
| Majority | 117 | 10.1 | |||
| Turnout | 1,153 | ||||
| Conservative hold | Swing | ||||
| Party | Candidate | Votes | % | ±% | |
|---|---|---|---|---|---|
| Labour | Gillian Troughton | 435 | 47.5 | -13.0 | |
| Conservative | Andrew Wonnacott | 304 | 33.2 | +2.3 | |
| UKIP | Eric Atkinson | 176 | 19.2 | +19.2 | |
| Majority | 131 | 14.3 | |||
| Turnout | 915 | ||||
| Labour hold | Swing | ||||
| Party | Candidate | Votes | % | ±% | |
|---|---|---|---|---|---|
| Liberal Democrats | Peter Thornton | 1,067 | 59.9 | +7.7 | |
| Labour | Gillian Troughton | 307 | 17.2 | -9.7 | |
| Conservative | Harry Taylor | 172 | 9.7 | -0.5 | |
| Green | Andy Mason | 128 | 7.2 | +7.2 | |
| UKIP | David Walker | 106 | 6.0 | -3.9 | |
| Majority | 760 | 42.7 | |||
| Turnout | 1,780 | ||||
| Liberal Democrats hold | Swing | ||||
| Party | Candidate | Votes | % | ±% | |
|---|---|---|---|---|---|
| Liberal Democrats | Steve Rooke | 1,009 | 52.3 | +0.7 | |
| Conservative | Ben Berry | 785 | 40.7 | +1.3 | |
| Labour | Penny Henderson | 88 | 4.6 | +4.6 | |
| Green | Kate Threadgold | 46 | 2.4 | -0.6 | |
| Majority | 224 | 11.6 | |||
| Turnout | 1,928 | ||||
| Liberal Democrats hold | Swing | ||||
2017-2023
| Party | Candidate | Votes | % | ±% | |
|---|---|---|---|---|---|
| Labour | Karen Lockney | 625 | 59.1 | -0.9 | |
| Conservative | Geoffrey Osborne | 292 | 27.6 | +0.6 | |
| Green | Helen Davison | 94 | 8.9 | +1.9 | |
| UKIP | Phil Douglass | 46 | 4.4 | -1.6 | |
| Majority | 333 | 31.5 | |||
| Turnout | 1,057 | ||||
| Labour hold | Swing | ||||
| Party | Candidate | Votes | % | ±% | |
|---|---|---|---|---|---|
| Liberal Democrats | Phil Douglass | 1,381 | 62.0 | +9.0 | |
| Conservative | Tom Harvey | 666 | 29.9 | -7.2 | |
| Green | Jill Abel | 109 | 4.9 | -1.1 | |
| Labour | Kate Love | 70 | 3.1 | -0.7 | |
| Majority | 715 | 32.1 | |||
| Turnout | 2,226 | ||||
| Liberal Democrats hold | Swing | ||||
| Party | Candidate | Votes | % | ±% | |
|---|---|---|---|---|---|
| Conservative | Tom Harvey | N/A | N/A | N/A | |
| Majority | N/A | N/A | |||
| Turnout | N/A | ||||
| Conservative hold | Swing | ||||
| Party | Candidate | Votes | % | ±% | |
|---|---|---|---|---|---|
| Conservative | Mike Mitchelson | 933 | 56.2 | +0.7 | |
| Liberal Democrats | Roger Dobson | 272 | 16.4 | +7.7 | |
| Labour | Chris Wills | 246 | 14.8 | -5.9 | |
| Green | Joanne Bates | 208 | 12.5 | +4.4 | |
| Majority | 661 | 39.8 | |||
| Turnout | 1,659 | ||||
| Conservative hold | Swing | ||||
| Party | Candidate | Votes | % | ±% | |
|---|---|---|---|---|---|
| Conservative | Catherine Bell | 807 | 41.3 | +11.4 | |
| Labour | Alan Smith | 546 | 28.0 | +1.2 | |
| Liberal Democrats | Fiona Jayatilaka | 411 | 21.0 | -18.8 | |
| Green | Jill Perry | 135 | 6.9 | +3.5 | |
| Independent | Nicky Cockburn | 54 | 2.8 | +2.8 | |
| Majority | 261 | 13.4 | |||
| Turnout | 1,953 | ||||
| Conservative gain from Liberal Democrats | Swing | ||||
| Party | Candidate | Votes | % | ±% | |
|---|---|---|---|---|---|
| Conservative | Debbie Garton | 621 | 36.8 | +15.8 | |
| Labour | Antony McGuckin | 603 | 35.7 | -0.4 | |
| Independent | Paul Scott | 368 | 21.8 | +21.8 | |
| Liberal Democrats | Margaret Bennett | 54 | 3.2 | +3.2 | |
| Green | Cathy Grout | 41 | 2.4 | -0.6 | |
| Majority | 18 | 1.1 | |||
| Turnout | 1,687 | ||||
| Conservative gain from Independent | Swing | ||||
| Party | Candidate | Votes | % | ±% | |
|---|---|---|---|---|---|
| Green | Judy Filmore | 885 | 39.6 | +32.4 | |
| Conservative | Andrew Butcher | 869 | 38.9 | -16.1 | |
| Labour | David Webster | 380 | 17.0 | -9.5 | |
| Liberal Democrats | Loraine Birchall | 102 | 4.6 | -6.7 | |
| Majority | 16 | 0.7 | |||
| Turnout | 2,236 | ||||
| Green gain from Conservative | Swing | ||||
| Party | Candidate | Votes | % | ±% | |
|---|---|---|---|---|---|
| Liberal Democrats | Roger Dobson | 857 | 71.0 | +60.8 | |
| Conservative | Tim Cheetham | 350 | 29.0 | -6.0 | |
| Majority | 507 | 42.0 | |||
| Turnout | 1,207 | ||||
| Liberal Democrats gain from Independent | Swing | ||||
References
- ^ "Welcome to Council and Democracy". Cumbria County Council. Retrieved 13 April 2010.
- ^ "Cumbria". BBC News Online. 19 April 2009. Retrieved 13 April 2010.
- ^ "Council minutes". Cumbria County Council. Retrieved 14 June 2022.
- ^ "Tough act to follow". Westmorland Gazette. 22 June 2001. Retrieved 14 June 2022.
- ^ "Former Cumbria county council leader dies, aged 76". Westmorland Gazette. 9 August 2010. Retrieved 14 June 2022.
- ^ "Cumbria County Council leader Jim Buchanan dies aged 67". BBC News. 9 April 2010. Retrieved 14 June 2022.
- ^ The County of Cumbria (Electoral Arrangements) Order 1981
- ^ "Cumbria". BBC News Online. Retrieved 13 April 2010.
- ^ "County Council By-Election result : Alston and East Fellside". Cumbria County Council. Retrieved 13 April 2010.
- guardian.co.uk. London. 25 July 2003. Retrieved 13 April 2010.
- ^ "23/6/2006 - St. John's by-election result". Cumbria County Council. 23 June 2006. Retrieved 13 April 2010.
- ^ "26/1/2007 - Brampton and Gilsland by-election result". Cumbria County Council. 26 January 2007. Retrieved 13 April 2010.
- ^ "23/2/2007 - Castle by-election result". Cumbria County Council. 23 February 2007. Retrieved 13 April 2010.
- ^ "26/10/2007 - Penrith East by election result". Cumbria County Council. 26 October 2007. Archived from the original on 24 July 2011. Retrieved 13 April 2010.
- ^ "19/12/2008 - Kells and Sandwith by-election results". Cumbria County Council. 13 April 2010. Retrieved 13 April 2010.
- ^ "Local Elections Archive Project — Longtown and Bewcastle Division". www.andrewteale.me.uk. Retrieved 23 September 2022.
- ^ "Local Elections Archive Project — Aspatria and Wharrels Division". www.andrewteale.me.uk. Retrieved 23 September 2022.
- ^ "Local Elections Archive Project — Keswick and Derwent Division". www.andrewteale.me.uk. Retrieved 23 September 2022.
- ^ "Local Elections Archive Project — Castle Division". www.andrewteale.me.uk. Retrieved 23 September 2022.
- ^ "Local Elections Archive Project — Kendal Strickland and Fell Division". www.andrewteale.me.uk. Retrieved 23 September 2022.
- ^ "Local Elections Archive Project — Aspatria and Wharrels Division". www.andrewteale.me.uk. Retrieved 23 September 2022.
- ^ "Local Elections Archive Project — Seaton Division". www.andrewteale.me.uk.
- ^ "Local Elections Archive Project — Belle Vue Division". www.andrewteale.me.uk. Retrieved 23 September 2022.
- ^ "Local Elections Archive Project — Castle Division". www.andrewteale.me.uk. Retrieved 23 September 2022.
- ^ "Local Elections Archive Project — Windermere Division". www.andrewteale.me.uk. Retrieved 23 September 2022.
- ^ "Local Elections Archive Project — Walney South Division". www.andrewteale.me.uk. Retrieved 23 September 2022.
- ^ "Local Elections Archive Project — Cartmel Division". www.andrewteale.me.uk. Retrieved 23 September 2022.
- ^ "Local Elections Archive Project — Greystoke and Hesket Division". www.andrewteale.me.uk. Retrieved 23 September 2022.
- ^ "Local Elections Archive Project — Howgate Division". www.andrewteale.me.uk. Retrieved 23 September 2022.
- ^ "Local Elections Archive Project — Kendal Strickland and Fell Division". www.andrewteale.me.uk. Retrieved 23 September 2022.
- ^ "Local Elections Archive Project — Windermere Division". www.andrewteale.me.uk. Retrieved 23 September 2022.
- ^ "Local Elections Archive Project — Denton Holme Division". www.andrewteale.me.uk. Retrieved 24 September 2022.
- ^ "Local Elections Archive Project — Kent Estuary Division". www.andrewteale.me.uk. Retrieved 24 September 2022.
- ^ "Local Elections Archive Project — Thursby Division". www.andrewteale.me.uk. Retrieved 24 September 2022.
- ^ "Local Elections Archive Project — Brampton Division". www.andrewteale.me.uk. Retrieved 24 September 2022.
- ^ "Local Elections Archive Project — Cockermouth North Division". www.andrewteale.me.uk. Retrieved 24 September 2022.
- ^ "Local Elections Archive Project — St John's and Great Clifton Division". www.andrewteale.me.uk. Retrieved 24 September 2022.
- ^ "Local Elections Archive Project — Ulverston West Division". www.andrewteale.me.uk. Retrieved 24 September 2022.
- ^ "Local Elections Archive Project — Corby and Hayton Division". www.andrewteale.me.uk. Retrieved 24 September 2022.
- By-election results Archived 29 March 2010 at the Wayback Machine