
Enthalpy–entropy chart

An enthalpy–entropy chart, also known as the H–S chart or Mollier diagram, plots the total heat against entropy,[1] describing the enthalpy of a thermodynamic system.[2] A typical chart covers a pressure range of 0.01–1000 bar, and temperatures up to 800 degrees Celsius.[3] It shows enthalpy in terms of internal energy , pressure and volume using the relationship (or, in terms of


History
The diagram was created in 1904, when Richard Mollier plotted the total heat[4] H against entropy S.[5][1]
At the 1923 Thermodynamics Conference held in Los Angeles it was decided to name, in his honor, as a "Mollier diagram" any thermodynamic diagram using the enthalpy as one of its axes.[6]
Details
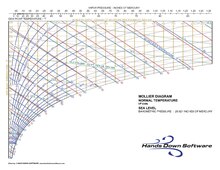

On the diagram, lines of constant pressure, constant temperature and volume are plotted, so in a two-phase region, the lines of constant pressure and temperature coincide.[7] Thus, coordinates on the diagram represent entropy and heat.[8]
The
In an isobaric process, the pressure remains constant, so the heat interaction is the change in enthalpy.[2]
In an
A vertical line in the h–s chart represents an
Lines of constant dryness fraction (x), sometimes called the quality, are drawn in the wet region and lines of constant temperature are drawn in the superheated region.[3] X gives the fraction (by mass) of gaseous substance in the wet region, the remainder being colloidal liquid droplets. Above the heavy line, the temperature is above the boiling point, and the dry (superheated) substance is gas only.
In general such charts do not show the values of specific volumes, nor do they show the enthalpies of saturated water at pressures which are of the order of those experienced in condensers in a thermal power station.[3] Hence the chart is only useful for enthalpy changes in the expansion process of the steam cycle.[3]
Applications and usage
It can be used in practical applications such as malting, to represent the grain–air–moisture system.[9]
The underlying property data for the Mollier diagram is identical to a
See also
References
- ^ ISBN 978-1-934015-14-8, retrieved 2010-06-25
- ^ ISBN 978-81-7371-461-0, retrieved 2010-06-25
- ^ ISBN 978-0-582-09193-1
- ^ "total heat" is used equivalently with "enthalpy", a term coined only after 1904, and in wider use from c. the 1920s.
- ^ Mollier, R. (20 February 1904). "Neue Diagramme zur technischen Wärmelehre" [New charts for engineering thermodynamics]. Zeitschrift des Vereines Deutscher Ingenieure (in German). 48 (8): 271–275.
- ^ See:
- Mollier, R. (8 September 1923). "Ein neues Diagramm für Dampfluftgemische" [A new diagram for water vapor-air mixtures]. Zeitschrift des Vereines Deutscher Ingenieure (in German). 67: 869–872.
- English translation: Mollier, Richard (December 1923). "A new diagram for water vapor-air mixtures". Mechanical Engineering. 45: 703–705.
- ISBN 978-81-7371-388-0, retrieved 2010-06-25
- ISBN 978-1-4437-3134-8, retrieved 2010-06-25
- ISBN 978-0-412-29800-4, retrieved 2010-06-25