
Hanksville, Utah
Hanksville, Utah | ||
|---|---|---|
Town | ||
FIPS code 49-33100 | | |
| GNIS feature ID | 2412723[2] | |
| Website | www | |
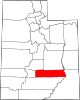
Hanksville is a small town in
Situated in the
History

The town was settled in 1882 and known for a time for the name given to the surrounding area, Graves Valley. It took the name of Hanksville in 1885, after Ebenezer Hanks, an early settler.[6] It was incorporated in 1999.[7]
The Rural Electrification Administration brought electricity to the community in 1960. Today agriculture, mining, and tourism are the main drivers to the local economy. Tourism is particularly important with people coming for recreation at Lake Powell, Capitol Reef National Park, the Henry Mountains, the San Rafael Swell, Goblin Valley State Park, Factory Butte, and the solitude of the surrounding deserts and slot canyons.
Hanksville was a supply post for Butch Cassidy and the Wild Bunch, who would hide out at Robbers Roost in the desert southeast of town.
During the uranium mining frenzy following World War II, Hanksville became a supply center for the prospectors and miners scouring the deserts of the Colorado Plateau. Many abandoned mines can be found in the deserts surrounding the town.
Demographics
| Census | Pop. | Note | %± |
|---|---|---|---|
| 1890 | 81 | — | |
| 1900 | 46 | −43.2% | |
| 1910 | 77 | 67.4% | |
| 1920 | 141 | 83.1% | |
| 1930 | 81 | −42.6% | |
| 1940 | 129 | 59.3% | |
| 1950 | 129 | 0.0% | |
| 1960 | 169 | 31.0% | |
| 1970 | 181 | 7.1% | |
| 1980 | 351 | 93.9% | |
| 1990 | 324 | −7.7% | |
| 2000 | 362 | 11.7% | |
| 2010 | 219 | −39.5% | |
| 2019 (est.) | 220 | [3] | 0.5% |
| U.S. Decennial Census[8] | |||
As of the
Climate
According to the Köppen climate classification system, Hanksville has a semi-arid climate, abbreviated "BSk" on climate maps.[10] It has a mean annual temperature of 53.9 °F (12.2 °C) and an annual mean rainfall of 6.16 inches (156.5 mm).[11]
| Climate data for Hanksville, Utah, 1991–2020 normals, extremes 1910–2022 | |||||||||||||
|---|---|---|---|---|---|---|---|---|---|---|---|---|---|
| Month | Jan | Feb | Mar | Apr | May | Jun | Jul | Aug | Sep | Oct | Nov | Dec | Year |
| Record high °F (°C) | 69 (21) |
75 (24) |
88 (31) |
98 (37) |
107 (42) |
110 (43) |
114 (46) |
110 (43) |
105 (41) |
97 (36) |
82 (28) |
70 (21) |
114 (46) |
| Mean maximum °F (°C) | 57.4 (14.1) |
65.3 (18.5) |
78.8 (26.0) |
87.5 (30.8) |
96.9 (36.1) |
104.4 (40.2) |
108.0 (42.2) |
104.3 (40.2) |
98.5 (36.9) |
88.2 (31.2) |
70.4 (21.3) |
57.4 (14.1) |
108.4 (42.4) |
| Mean daily maximum °F (°C) | 43.1 (6.2) |
51.2 (10.7) |
63.8 (17.7) |
70.8 (21.6) |
81.1 (27.3) |
93.4 (34.1) |
98.7 (37.1) |
95.2 (35.1) |
86.3 (30.2) |
71.5 (21.9) |
55.7 (13.2) |
42.9 (6.1) |
71.1 (21.8) |
| Daily mean °F (°C) | 29.1 (−1.6) |
36.2 (2.3) |
46.4 (8.0) |
53.1 (11.7) |
62.8 (17.1) |
73.1 (22.8) |
79.8 (26.6) |
76.8 (24.9) |
67.1 (19.5) |
53.3 (11.8) |
39.7 (4.3) |
29.0 (−1.7) |
53.9 (12.1) |
| Mean daily minimum °F (°C) | 15.2 (−9.3) |
21.1 (−6.1) |
28.9 (−1.7) |
35.3 (1.8) |
44.4 (6.9) |
52.7 (11.5) |
60.9 (16.1) |
58.3 (14.6) |
47.9 (8.8) |
35.1 (1.7) |
23.6 (−4.7) |
15.0 (−9.4) |
36.5 (2.5) |
| Mean minimum °F (°C) | 1.2 (−17.1) |
6.8 (−14.0) |
16.4 (−8.7) |
23.6 (−4.7) |
33.1 (0.6) |
42.1 (5.6) |
51.1 (10.6) |
48.8 (9.3) |
35.7 (2.1) |
22.0 (−5.6) |
10.7 (−11.8) |
2.6 (−16.3) |
−2.3 (−19.1) |
| Record low °F (°C) | −35 (−37) |
−33 (−36) |
4 (−16) |
10 (−12) |
23 (−5) |
31 (−1) |
38 (3) |
35 (2) |
24 (−4) |
−6 (−21) |
−8 (−22) |
−24 (−31) |
−35 (−37) |
| Average precipitation inches (mm) | 0.40 (10) |
0.39 (9.9) |
0.47 (12) |
0.45 (11) |
0.43 (11) |
0.23 (5.8) |
0.71 (18) |
0.57 (14) |
0.83 (21) |
0.87 (22) |
0.47 (12) |
0.34 (8.6) |
6.16 (155.3) |
| Average snowfall inches (cm) | 2.5 (6.4) |
1.1 (2.8) |
0.5 (1.3) |
0.0 (0.0) |
0.0 (0.0) |
0.0 (0.0) |
0.0 (0.0) |
0.0 (0.0) |
0.0 (0.0) |
0.1 (0.25) |
0.6 (1.5) |
2.5 (6.4) |
7.3 (18.65) |
| Average precipitation days (≥ 0.01 in) | 4.2 | 4.4 | 4.0 | 3.7 | 3.7 | 2.3 | 4.5 | 5.3 | 4.7 | 4.1 | 2.8 | 3.6 | 47.3 |
| Average snowy days (≥ 0.1 in) | 1.4 | 0.6 | 0.3 | 0.0 | 0.0 | 0.0 | 0.0 | 0.0 | 0.0 | 0.1 | 0.5 | 1.6 | 4.5 |
| Source 1: NOAA[11] | |||||||||||||
| Source 2: National Weather Service[12] | |||||||||||||
See also
 Utah portal
- List of cities and towns in Utah
References
- ^ "2019 U.S. Gazetteer Files". United States Census Bureau. Retrieved August 7, 2020.
- ^ a b U.S. Geological Survey Geographic Names Information System: Hanksville
- ^ a b "Population and Housing Unit Estimates". United States Census Bureau. May 24, 2020. Retrieved May 27, 2020.
- ^ "Geographic Identifiers: 2010 Demographic Profile Data (G001): Hanksville town, Utah". U.S. Census Bureau, American Factfinder. Archived from the original on February 12, 2020. Retrieved February 4, 2013.
- ^ "Henry Mountains Field Station". Archived from the original on March 4, 2016. Retrieved October 12, 2015.
- ISBN 0-87480-345-4.
- ^ Geographic Change Notes: Utah Archived 2008-05-02 at the Wayback Machine, United States Census Bureau, 2007. Accessed 2009-03-04.
- ^ "Census of Population and Housing". Census.gov. Retrieved June 4, 2015.
- ^ "U.S. Census website". United States Census Bureau. Retrieved January 19, 2012.
- ^ "Hanksville, Utah Köppen Climate Classification (Weatherbase)". Weatherbase. Retrieved February 13, 2019.
- ^ a b "U.S. Climate Normals Quick Access – Station: Hanksville, UT". National Oceanic and Atmospheric Administration. Retrieved February 20, 2023.
- ^ "NOAA Online Weather Data – NWS Salt Lake City". National Weather Service. Retrieved February 20, 2023.
External links
Places adjacent to Hanksville, Utah | |
|---|---|
 | ||||
| CDPs | ||||
| Unincorporated communities | ||||
| Ghost towns | ||||
| ||||
| International | |
|---|---|
| National | |