
Nevada's 2nd congressional district
| Nevada's 2nd congressional district | |
|---|---|


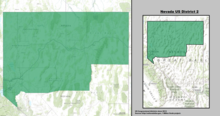
Interactive map of district boundaries. Points indicate major cities in the district with a population over 50,000, ordered by population (Reno, Sparks, and Carson City). | |
| Representative | |
| Population (2023) | 793,631 |
| Median household income | $81,407[1] |
| Ethnicity |
|
| Cook PVI | R+7[2] |
Nevada's 2nd congressional district is a
Political history
The district was initially created after the redistricting cycle after the 1980 census, when Nevada was split into districts for the first time. From then until 2013, it occupied all of the state outside of Clark County. From 1993 to 2013, it also included the far northern portion of Clark County. Until 2013, it was the third-largest congressional district by land area that did not cover an entire state. Even though it lost much of its southern portion to the new 4th District after the 2010 census, it is still the fifth-largest district in the nation that does not cover an entire state.
The 2nd district has always leaned Republican. It has been represented by only four people since its creation, all Republicans. Democrats have only made four serious bids for the seat. In presidential elections, the district has historically voted Republican; George W. Bush won the district by 20 points in 2000 and 16 points in 2004. However, in the 2008 election John McCain earned only 88 votes more (out of 335,720 votes) than Barack Obama in the district.
On April 21, 2011, U.S. Senator John Ensign (R-Nev.), plagued by scandal and facing an inquiry by the Senate Ethics Committee, announced his resignation effective May 3.[3] On April 27, Governor Brian Sandoval announced he would appoint Dean Heller, the 2nd district's third-term congressman, to fill out Ensign's term in the Senate. Heller had already planned to run for the seat after Ensign announced a month earlier that he would not run for a third term. To fill the vacancy created by Heller's resignation on May 9, Sandoval was required to call a special election to be held within six months of the occurrence of the vacancy.[4]
A special election was held on September 13, 2011. Former Republican state senator Mark Amodei defeated Democratic State Treasurer Kate Marshall.[5]
Recent election results from statewide races
| Year | Office | Results[6] |
|---|---|---|
| 2008 | President | McCain 48.79% - 48.76% |
| 2010 | Senate | Angle 54% - 46% |
| Governor | Sandoval 66% - 34% | |
| Secretary of State | Miller 53% - 47% | |
| Treasurer | Martin 53% - 47% | |
| 2012 | President | Romney 55% - 45% |
| 2016 | President | Trump 53% - 39% |
| Senate | Heck 53% - 39% | |
| 2018 | Senate | Heller 54% - 42% |
| Governor | Laxalt 54% - 41% | |
| Lt. Governor | Roberson 50% - 44% | |
Secretary of State
|
Cegavske 56% - 41% | |
| Attorney General | Duncan 55% - 38% | |
| Treasurer | Beers 55% - 39% | |
| 2020 | President | Trump 54% - 43% |
| 2022 | Senate | Laxalt 54% - 43% |
| Governor | Lombardo 55% - 41% | |
| Lt. Governor | Anthony 55% - 39% | |
| Secretary of State | Marchant 52% - 43% | |
| Attorney General | Chattah 48.3% - 47.5% | |
| Treasurer | Fiore 53% - 41% | |
| 2024 | President | Trump 56% - 42% |
| Senate | Brown 51% - 43% |
Composition
For the 118th and successive Congresses (based on redistricting following the 2020 census), the district contains all or portions of the following counties and communities:[7]
Churchill County (2)
Douglas County (21)
- All 21 communities
Elko County (12)
- All 12 communities
Eureka County (2)
Humboldt County (8)
- All 8 communities
Lander County (3)
- All 3 communities
Lincoln County (0)
- Contains unincorporated area of Lincoln County
Lyon County (7)
- Dayton, Fernley, Silver City, Silver Springs, Smith Valley (part; also 4th), Stagecoach, Yerington
Pershing County (6)
- All 6 communities
Storey County (5)
- All 5 communities
Washoe County (17)
- All 17 communities
- All 6 communities
List of members representing the district


.jpg)
.jpg)

.svg)
Election results
1982
| Party | Candidate | Votes | % | ||
|---|---|---|---|---|---|
Republican
|
Barbara Vucanovich | 70,188 | 55.49 | ||
Democratic
|
Mary Gojack | 52,265 | 41.32 | ||
Libertarian
|
Teresa Vuceta | 4,043 | 3.20 | ||
| Total votes | 126,496 | 100.0 | |||
Republican win (new seat)
| |||||
1984
| Party | Candidate | Votes | % | |
|---|---|---|---|---|
Republican
|
Barbara Vucanovich (Incumbent) | 99,775 | 71.21 | |
Democratic
|
Andrew Barbano | 36,130 | 25.79 | |
Libertarian
|
Dan Becan | 4,201 | 3.00 | |
| Total votes | 140,106 | 100.0 | ||
Republican hold
| ||||
1986
| Party | Candidate | Votes | % | |
|---|---|---|---|---|
Republican
|
Barbara Vucanovich (Incumbent) | 83,479 | 58.41 | |
Democratic
|
Pete Sferrazza | 59,433 | 41.59 | |
| Total votes | 142,912 | 100.0 | ||
Republican hold
| ||||
1988
| Party | Candidate | Votes | % | |
|---|---|---|---|---|
Republican
|
Barbara Vucanovich (Incumbent) | 105,981 | 57.26 | |
Democratic
|
Jim Spoo | 75,163 | 40.61 | |
Libertarian
|
Kent Cromwell | 3,953 | 2.14 | |
| Total votes | 185,097 | 100.0 | ||
Republican hold
| ||||
1990
| Party | Candidate | Votes | % | |
|---|---|---|---|---|
Republican
|
Barbara Vucanovich (Incumbent) | 103,508 | 59.08 | |
Democratic
|
Jane Wisdom | 59,581 | 34.01 | |
Libertarian
|
Dan Becan | 12,120 | 6.92 | |
| Total votes | 175,209 | 100.0 | ||
Republican hold
| ||||
1992
| Party | Candidate | Votes | % | |
|---|---|---|---|---|
Republican
|
Barbara Vucanovich (Incumbent) | 129,575 | 47.91 | |
Democratic
|
Pete Sferrazza | 117,199 | 43.33 | |
| Independent American | Daniel M. Hansen | 13,285 | 4.91 | |
Libertarian
|
Dan Becan | 7,552 | 2.79 | |
| Populist | Don Golden | 2,850 | 1.05 | |
| Total votes | 270,461 | 100.0 | ||
Republican hold
| ||||
1994
| Party | Candidate | Votes | % | |
|---|---|---|---|---|
Republican
|
Barbara Vucanovich (Incumbent) | 142,202 | 63.50 | |
Democratic
|
Janet Greeson | 65,390 | 29.20 | |
| Independent American | Thomas F. Jefferson | 9,615 | 4.29 | |
Natural Law
|
Lois Avery | 6,725 | 3.00 | |
| Total votes | 223,932 | 100.0 | ||
Republican hold
| ||||
1996
| Party | Candidate | Votes | % | |
|---|---|---|---|---|
Republican
|
Jim Gibbons
|
162,310 | 58.56 | |
Democratic
|
Thomas "Spike" Wilson | 97,942 | 35.26 | |
| Independent American | Daniel M. Hansen | 8,780 | 3.17 | |
Natural Law
|
Lois Avery | 4,628 | 1.67 | |
Libertarian
|
Louis R. Tomburello | 3,732 | 1.35 | |
| Total votes | 277,192 | 100.0 | ||
Republican hold
| ||||
1998
| Party | Candidate | Votes | % | |
|---|---|---|---|---|
Republican
|
Jim Gibbons (Incumbent)
|
201,623 | 81.05 | |
| Independent American | Christopher Horne | 20,738 | 8.34 | |
Libertarian
|
Louis R. Tomburello | 18,561 | 7.46 | |
Natural Law
|
Robert W. Winquist | 7,841 | 3.15 | |
| Total votes | 248,763 | 100.0 | ||
Republican hold
| ||||
2000
| Party | Candidate | Votes | % | |
|---|---|---|---|---|
Republican
|
Jim Gibbons (Incumbent)
|
229,608 | 64.50 | |
Democratic
|
Tierney Cahill | 106,379 | 29.88 | |
| Independent American | Daniel M. Hansen | 5,582 | 1.57 | |
| Green | A. Charles Laws | 5,547 | 1.56 | |
Libertarian
|
Terry Savage | 5,343 | 1.50 | |
| Citizens First | Ken Brenneman | 2,367 | 0.66 | |
Natural Law
|
Robert W. Winquist | 1,143 | 0.32 | |
| Total votes | 355,969 | 100.0 | ||
Republican hold
| ||||
2002
| Party | Candidate | Votes | % | |
|---|---|---|---|---|
Republican
|
Jim Gibbons (Incumbent)
|
149,574 | 74.34 | |
Democratic
|
Travis O. Souza | 40,189 | 19.97 | |
| Independent American | Janine Hansen | 7,240 | 3.60 | |
Libertarian
|
Brendan Trainor | 3,413 | 1.70 | |
Natural Law
|
Robert W. Winquist | 784 | 0.39 | |
| Total votes | 201,200 | 100.0 | ||
Republican hold
| ||||
2004
| Party | Candidate | Votes | % | |
|---|---|---|---|---|
Republican
|
Jim Gibbons (Incumbent)
|
195,466 | 67.15 | |
Democratic
|
Angie G. Cochran | 79,978 | 27.48 | |
| Independent American | Janine Hansen | 10,638 | 3.65 | |
Libertarian
|
Brendan Trainor | 4,997 | 1.72 | |
| Total votes | 291,079 | 100.0 | ||
Republican hold
| ||||
2006
| Party | Candidate | Votes | % | |
|---|---|---|---|---|
Republican
|
Dean Heller | 117,168 | 50.35 | |
Democratic
|
Jill Derby | 104,593 | 44.94 | |
| Independent | Daniel Rosen | 5,524 | 2.37 | |
| Independent American | James C. Kroshus | 5,439 | 2.34 | |
| Total votes | 232,724 | 100.0 | ||
Republican hold
| ||||
2008
| Party | Candidate | Votes | % | |
|---|---|---|---|---|
Republican
|
Dean Heller (Incumbent) | 170,771 | 51.82 | |
Democratic
|
Jill Derby | 136,548 | 41.44 | |
| Independent American | John Everhart | 11,179 | 3.39 | |
Libertarian
|
Sean Patrick Morse | 5,740 | 1.74 | |
| Green | Craig Bergland | 5,282 | 1.60 | |
| Total votes | 329,520 | 100.0 | ||
Republican hold
| ||||
2010
| Party | Candidate | Votes | % | |
|---|---|---|---|---|
Republican
|
Dean Heller (Incumbent) | 169,458 | 63.30 | |
Democratic
|
Nancy Price | 87,421 | 32.66 | |
| Independent American | Russell Best | 10,829 | 4.05 | |
| Total votes | 267,708 | 100.0 | ||
Republican hold
| ||||
2011 (special)
| Party | Candidate | Votes | % | |
|---|---|---|---|---|
Republican
|
Mark Amodei | 75,180 | 57.92 | |
Democratic
|
Kate Marshall | 46,818 | 36.07 | |
| Independent | Helmuth Lehmann | 5,372 | 4.14 | |
| Independent American | Timothy Fasano | 2,421 | 1.87 | |
| Total votes | 129,791 | |||
Republican hold
| ||||
2012
| Party | Candidate | Votes | % | |
|---|---|---|---|---|
Republican
|
Mark Amodei (Incumbent) | 162,213 | 57.63 | |
Democratic
|
Samuel Koepnick | 102,019 | 36.25 | |
| Independent American | Russell Best | 6,051 | 2.15 | |
| Independent | Michael Haines | 11,166 | 3.97 | |
| Total votes | 281,499 | 100.0 | ||
Republican hold
| ||||
2014
| Party | Candidate | Votes | % | |
|---|---|---|---|---|
Republican
|
Mark Amodei (Incumbent) | 122,402 | 65.73 | |
Democratic
|
Kristen Spees | 52,016 | 27.93 | |
| Independent American | Janine Hansen | 11,792 | 6.33 | |
| Total votes | 186,210 | 100.0 | ||
Republican hold
| ||||
2016
| Party | Candidate | Votes | % | |
|---|---|---|---|---|
Republican
|
Mark Amodei (Incumbent) | 182,676 | 58.30 | |
Democratic
|
H.D. "Chip" Evans | 115,722 | 36.93 | |
| Independent American | John H. Everhart | 8,693 | 2.77 | |
| Independent | Drew Knight | 6,245 | 1.99 | |
| Total votes | 313,336 | 100.0 | ||
Republican hold
| ||||
2018
| Party | Candidate | Votes | % | |
|---|---|---|---|---|
Republican
|
Mark Amodei (Incumbent) | 167,435 | 58.2 | |
Democratic
|
Clint Koble | 120,102 | 41.8 | |
| Total votes | 287,537 | 100.0 | ||
Republican hold
| ||||
2020
| Party | Candidate | Votes | % | |
|---|---|---|---|---|
| Republican | Mark Amodei (incumbent) | 216,078 | 56.5 | |
| Democratic | Patricia Ackerman | 155,780 | 40.7 | |
| Independent American | Janine Hansen | 10,815 | 2.8 | |
| Total votes | 382,673 | 100.0 | ||
| Republican hold | ||||
2022
| Party | Candidate | Votes | % | |
|---|---|---|---|---|
| Republican | Mark Amodei (incumbent) | 185,467 | 59.7 | |
| Democratic | Elizabeth Mercedes Krause | 117,371 | 37.8 | |
| Independent American | Russell Best | 4,194 | 1.4 | |
| Libertarian | Darryl Baber | 3,466 | 1.1 | |
| Total votes | 310,678 | 100.0 | ||
| Republican hold | ||||
2024
| Party | Candidate | Votes | % | |
|---|---|---|---|---|
| Republican | Mark Amodei (incumbent) | 219,919 | 55.0 | |
| Independent | Greg Kidd | 144,064 | 36.1 | |
| Independent American | Lynn Chapman | 19,784 | 4.9 | |
| Libertarian | Javi Tachiquin | 15,817 | 4.0 | |
| Total votes | 399,584 | 100.0 | ||
| Republican hold | ||||
Historical district boundaries

See also
Notes
- ^ "My Congressional District".
- ^ a b "2025 Cook PVI℠: District Map and List (119th Congress)". Cook Political Report. Retrieved April 5, 2025.
- ^ Demirjian, Karoun (April 21, 2011). "Sen. John Ensign to resign, Dean Heller likely replacement". Las Vegas Sun. Retrieved April 29, 2011.
- ^ Damon, Anjeanette; Demirjian, Karoun (April 28, 2011). "Dean Heller in U.S. Senate shifts landscape in state politics". Las Vegas Sun. Retrieved April 29, 2011.
- ^ Archived 22 October 2012 at the Wayback Machine
- ^ https://davesredistricting.org/maps#viewmap::eb89e40d-595f-485f-9a43-d1bbdd6d0cb4
- ^ https://www2.census.gov/geo/maps/cong_dist/cd118/cd_based/ST32/CD118_NV02.pdf
- ^ "1982 Election Results" (PDF). Retrieved November 7, 2018.
- ^ "1984 Election Results" (PDF). Retrieved November 7, 2018.
- ^ "1986 Election Results" (PDF). Retrieved November 7, 2018.
- ^ "1988 Election Results" (PDF). Retrieved November 7, 2018.
- ^ "1990 Election Results" (PDF). Retrieved November 7, 2018.
- ^ 1992 Election Results
- ^ "1994 Election Results" (PDF). Retrieved November 7, 2018.
- ^ 1996 Election Results
- ^ "1998 Election Results" (PDF). Retrieved November 7, 2018.
- ^ "2000 Election Results" (PDF). Retrieved November 7, 2018.
- ^ "2002 Election Results" (PDF). Retrieved November 7, 2018.
- ^ "2004 Election Results" (PDF). Retrieved November 7, 2018.
- ^ "2006 Election Results" (PDF). Retrieved November 7, 2018.
- ^ "2008 Election Results" (PDF). Retrieved November 7, 2018.
- ^ "Congressional results". www.nvsos.gov. Retrieved November 7, 2018.
- ^ "2011 Official Special Election Results September 13, 2011". Nevada Secretary of State. Retrieved July 29, 2019.
- ^ "2012 Official Statewide General Election Coverage and Reports". www.nvsos.gov. Retrieved November 7, 2018.
- ^ "Silver State Election Night Results – 2014". Nevada Secretary of State. Retrieved January 17, 2017.
- ^ "Silver State Election Night Results – 2016". Nevada Secretary of State. Retrieved January 17, 2017.
- ^ "Silver State 2020 Election Results - U.S. Congress". Nevada Secretary of State. Retrieved November 27, 2020.
- ^ Cite error: The named reference
genrwas invoked but never defined (see the help page).
References
- Martis, Kenneth C. (1989). The Historical Atlas of Political Parties in the United States Congress. New York: Macmillan Publishing Company.
- Congressional Biographical Directory of the United States 1774–present