Source: Wikipedia, the free encyclopedia.
2005 Apulian regional election|
|
|
|
|
 |
|
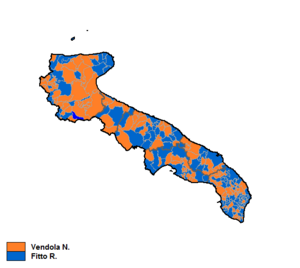
The Apulian regional election of 2005 took place on 3–4 April 2005.
.
Centre-left primary election
The centre-left candidate was chosen through primary elections, which were won by surprise by Nichi Vendola.[1]
Results
3–4 April 2005 Apulian regional election results

|
| Candidates
|
Votes
|
%
|
Seats
|
Parties
|
Votes
|
%
|
Seats
|
|
|
Nichi Vendola
|
1,165,536
|
49.84
|
1
|
|
|
Democrats of the Left
|
356,369
|
16.63
|
14
|
|
|
Democracy is Freedom – The Daisy
|
208,806
|
9.74
|
8
|
|
|
Communist Refoundation Party
|
109,146
|
5.09
|
4
|
|
|
Italian Democratic Socialists
|
86,096
|
4.01
|
3
|
|
|
Union of Democrats for Europe
|
70,293
|
3.28
|
3
|
|
|
The Apulian Spring
|
55,335
|
2.58
|
3
|
|
|
Party of Italian Communists
|
48,141
|
2.24
|
2
|
|
|
Autonomist Socialists – PSDI – MRE
|
47,511
|
2.22
|
2
|
|
|
Italy of Values
|
38,120
|
1.78
|
1
|
|
|
Federation of the Greens
|
33,309
|
1.55
|
1
|
|
|
United Democratic Christians
|
8,397
|
0.39
|
–
|
|
|
Pensioners' Party
|
3,959
|
0.18
|
–
|
| Total
|
1,065,752
|
49.69
|
41
|
|
|
Raffaele Fitto
|
1,151,405
|
49.24
|
1
|
|
|
Forza Italia
|
381,663
|
17.80
|
10
|
|
|
National Alliance
|
259,563
|
12.10
|
7
|
|
|
Apulia First of All
|
196,281
|
9.15
|
5
|
|
|
Union of Christian and Centre Democrats
|
167,038
|
7.79
|
4
|
|
|
New PSI – PRI
|
48,109
|
2.24
|
1
|
|
|
Social Idea Movement
|
10,099
|
0.47
|
–
|
| Total
|
1.062.753
|
49.55
|
27
|
|
|
Gianfelice Galassi
|
10,973
|
0.47
|
–
|
|
Social Alternative
|
9,368
|
0.44
|
–
|
|
|
Luca Scalabrini
|
10,477
|
0.45
|
–
|
|
Christian Democracy
|
6,791
|
0.32
|
–
|
|
|
| Total candidates
|
2,338,391
|
100.00
|
2
|
Total parties
|
2,144,664
|
100.00
|
68
|
| Source: Ministry of the Interior – Historical Archive of Elections
|
References


