Iowa's 6th congressional district
Appearance
| Iowa's 6th congressional district | |
|---|---|
Obsolete district | |
| Created | 1860 |
| Eliminated | 1990 |
| Years active | 1863–1993 |
Iowa's 6th congressional district is a former U.S. congressional district in the State of Iowa. It existed in elections from 1862 to 1992, when it was lost due to Iowa's population growth rate being lower than that of the country as a whole.
The district was created during the
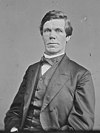
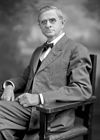
1862 general election. Its original representative, Asahel W. Hubbard, was from Sioux City in Northwestern Iowa, but redistricting caused the district to be relocated, first to central Iowa (from 1869 to 1874), then to south-central Iowa (from 1875 to 1932), then the Des Moines area (from 1933 to 1942) and then north-central Iowa (from 1943 to 1962). From 1963 to 1992, the district was made up of counties in the northwestern part of the state. Fred Grandy
, the 6th district's last representative, was, like its first, a Sioux City native.
List of members representing the district
| Member | Party | Term | Congress | Electoral history |
|---|---|---|---|---|
| District created March 4, 1863 | ||||
 Asahel W. Hubbard (Sioux City) |
Republican | March 4, 1863 – March 3, 1869 |
38th 39th 40th |
Re-elected in 1866 .Retired. |
 Charles Pomeroy (Fort Dodge) |
Republican | March 4, 1869 – March 3, 1871 |
41st | Elected in 1868 .Lost renomination. |
Montana )
|
Republican | March 4, 1871 – March 3, 1873 |
42nd | Elected in 1870. .
Redistricted to the 9th district |
 William Loughridge (Oskaloosa) |
Republican | March 4, 1873 – March 3, 1875 |
43rd | Elected in 1872 .Lost renomination. |
 Ezekiel S. Sampson (Sigourney) |
Republican | March 4, 1875 – March 3, 1879 |
44th 45th |
Re-elected in 1876 .Lost re-election. |
 James Weaver (Bloomfield) |
Greenback | March 4, 1879 – March 3, 1881 |
46th | Elected in 1878. .
Retired to run for president |
 Marsena E. Cutts (Oskaloosa) |
Republican | March 4, 1881 – March 3, 1883 |
47th | Elected in 1880 .Lost contested election. |
| John C. Cook (Newton) |
Democratic | March 3, 1883 – March 3, 1883 |
Won contested election but only served one day. Lost re-election. | |
 Marsena E. Cutts (Oskaloosa) |
Republican | March 4, 1883 – September 1, 1883 |
48th | Elected in 1882 .Died. |
| Vacant | September 1, 1883 – October 9, 1883 |
|||
| John C. Cook (Newton) |
Democratic | October 9, 1883 – March 3, 1885 |
Elected to finish Cutts's term .Lost re-election. | |
 James Weaver (Bloomfield) |
Greenback | March 4, 1885 – March 3, 1889 |
49th 50th |
Re-elected in 1886 .Lost re-election. |
 John F. Lacey (Oskaloosa) |
Republican | March 4, 1889 – March 3, 1891 |
51st | Elected in 1888 .Lost re-election. |
 Frederick E. White (Webster) |
Democratic | March 4, 1891 – March 3, 1893 |
52nd | Elected in 1890 .Lost re-election. |
 John F. Lacey (Oskaloosa) |
Republican | March 4, 1893 – March 3, 1907 |
53rd 54th 55th 56th 57th 58th 59th |
Re-elected in 1904 .Lost re-election. |
 Daniel W. Hamilton (Sigourney) |
Democratic | March 4, 1907 – March 3, 1909 |
60th | Elected in 1906 .Lost re-election. |
 Nathan E. Kendall (Albia) |
Republican | March 4, 1909 – March 3, 1913 |
61st 62nd |
Re-elected in 1910 .Renominated but withdrew prior to election. |
 Sanford Kirkpatrick (Ottumwa) |
Democratic | March 4, 1913 – March 3, 1915 |
63rd | Elected in 1912 .Lost renomination. |
 C. William Ramseyer (Bloomfield) |
Republican | March 4, 1915 – March 3, 1933 |
64th 65th 66th 67th 68th 69th 70th 71st 72nd |
Re-elected in 1930. and lost renomination there.
Redistricted to the 5th district |
 Cassius C. Dowell (Des Moines) |
Republican | March 4, 1933 – January 3, 1935 |
73rd | Redistricted from the re-elected in 1932 .Lost re-election. |
 Hubert Utterback (Des Moines) |
Democratic | January 3, 1935 – January 3, 1937 |
74th | Elected in 1934. .
Retired to run for U.S. Senator |
 Cassius C. Dowell (Des Moines) |
Republican | January 3, 1937 – February 4, 1940 |
75th 76th |
Re-elected in 1938 .Died. |
| Vacant | February 4, 1940 – March 5, 1940 |
76th | ||
| Robert K. Goodwin (Redfield) |
Republican | March 5, 1940 – January 3, 1941 |
76th | Elected to finish Dowell's term .Retired. |
 Paul Cunningham (Des Moines) |
Republican | January 3, 1941 – January 3, 1943 |
77th | Elected in 1940. .
Redistricted to the 5th district |
 Fred C. Gilchrist (Laurens) |
Republican | January 3, 1943 – January 3, 1945 |
78th | Redistricted from the re-elected in 1942 .Lost renomination. |
 James I. Dolliver (Fort Dodge) |
Republican | January 3, 1945 – January 3, 1957 |
79th 80th 81st 82nd 83rd 84th |
Re-elected in 1954 .Lost re-election. |
 Merwin Coad (Boone) |
Democratic | January 3, 1957 – January 3, 1963 |
85th 86th 87th |
Re-elected in 1960 .Retired. |
 Charles B. Hoeven (Alton) |
Republican | January 3, 1963 – January 3, 1965 |
88th | Redistricted from the re-elected in 1962 .Retired. |
 Stanley L. Greigg (Sioux City) |
Democratic | January 3, 1965 – January 3, 1967 |
89th | Elected in 1964 .Lost re-election. |
 Wiley Mayne (Sioux City) |
Republican | January 3, 1967 – January 3, 1975 |
90th 91st 92nd 93rd |
Re-elected in 1972 .Lost re-election. |
 Berkley Bedell (Spirit Lake) |
Democratic | January 3, 1975 – January 3, 1987 |
94th 95th 96th 97th 98th 99th |
Re-elected in 1984 .Retired. |
 Fred Grandy (Sioux City) |
Republican | January 3, 1987 – January 3, 1993 |
100th 101st 102nd |
Re-elected in 1990. .
Redistricted to the 5th district |
| District eliminated January 3, 1993 | ||||
The district was eliminated as a result of the 1990 census. All of the district was put in the 5th district except for Cerro Gordo County which was put in the 2nd district.
General election history (from 1920)
See also
References
- ^ "Election Statistics,". 2005. Archived from the original on July 25, 2007.
- Martis, Kenneth C. (1989). The Historical Atlas of Political Parties in the United States Congress. New York: Macmillan Publishing Company.
- Martis, Kenneth C. (1982). The Historical Atlas of United States Congressional Districts. New York: Macmillan Publishing Company.
- Congressional Biographical Directory of the United States 1774–present
