
Kirklees Metropolitan Borough Council elections
wards. Elections are held three years out of four, with one third of the councillors (one for each ward) elected each time for a four-year term.[1]
Council elections
| Election | Labour | Conservative | Liberal Democrat/Liberal | UKIP | Green | Independent | Other | Control |
|---|---|---|---|---|---|---|---|---|
| 1973[2] | 45 | 14 | 8 | 0 | 0 | 1 | 0 | Labour |
| 1975[3] | 36 | 28 | 7 | 0 | 0 | 1 | 0 | Labour hold |
| 1976[4] | 25 | 50 | 9 | 0 | 0 | 0 | 0 | Conservative gain from Labour |
| 1978[5] | 15 | 48 | 9 | 0 | 0 | 0 | 0 | Conservative hold |
| 1979[6] | 32 | 35 | 5 | 0 | 0 | 0 | 0 | Conservative lose to no overall control |
| 1980[7] | 44 | 25 | 3 | 0 | 0 | 0 | 0 | Labour gain from no overall control |
| 1982[8][9] | 37 | 19 | 12 | 0 | 0 | 0 | 4 | Labour hold |
| 1983[10] | 37 | 20 | 12 | 0 | 0 | 0 | 3 | Labour hold |
| 1984[11] | 37 | 18 | 14 | 0 | 0 | 0 | 3 | Labour hold |
| 1986[12] | 36 | 18 | 17 | 0 | 0 | 1 | 0 | Labour hold |
| 1987[13] | 33 | 21 | 18 | 0 | 0 | 0 | 0 | Labour lose to no overall control |
| 1988[14] | 33 | 23 | 15 | 0 | 0 | 1 | 0 | No overall control |
| 1990[15] | 45 | 15 | 12 | 0 | 0 | 0 | 0 | Labour gain from no overall control |
| 1992[16] | 41 | 19 | 10 | 0 | 0 | 2 | 0 | Labour hold |
| 1994[17] | 35 | 21 | 15 | 0 | 0 | 1 | 0 | Labour lose to no overall control |
| 1995[18] | 40 | 16 | 14 | 0 | 0 | 2 | 0 | Labour gain from no overall control |
| 1996[19] | 45 | 6 | 18 | 0 | 1 | 1 | 1 vacancy | Labour hold |
| 1998[20] | 43 | 7 | 20 | 0 | 2 | 0 | 0 | Labour hold |
| 1999[21] | 36 | 10 | 23 | 0 | 3 | 0 | 0 | Labour lose to no overall control |
| 2000[22] | 25 | 15 | 29 | 0 | 3 | 0 | 0 | No overall control |
| 2002[23] | 26 | 15 | 28 | 0 | 3 | 0 | 0 | No overall control |
| 2003[24] | 22 | 16 | 31 | 0 | 3 | 0 | 0 | No overall control |
| 2004[25] | 17 | 22 | 25 | 0 | 3 | 1 | 1 | No overall control |
| 2006[26] | 20 | 21 | 20 | 0 | 3 | 1 | 4 | No overall control |
| 2007[27] | 22 | 20 | 18 | 0 | 4 | 1 | 4 | No overall control |
| 2008[28] | 22 | 21 | 19 | 0 | 4 | 0 | 3 | No overall control |
| 2010[29] | 24 | 19 | 20 | 0 | 4 | 2 | 0 | No overall control |
| 2011[30] | 27 | 21 | 14 | 0 | 4 | 3 | 0 | No overall control |
| 2012[31] | 32 | 18 | 10 | 0 | 5 | 4 | 0 | No overall control |
| 2014[32] | 32 | 18 | 10 | 0 | 5 | 4 | 0 | No overall control |
| 2015[33] | 34 | 18 | 10 | 0 | 4 | 3 | 0 | No overall control |
| 2016[34] | 34 | 20 | 9 | 0 | 3 | 3 | 0 | No overall control |
| 2018[35] | 36 | 20 | 7 | 0 | 3 | 3 | 0 | Labour gain from no overall control |
| 2019[36] | 35 | 17 | 10 | 0 | 3 | 4 | 0 | Labour hold |
| 2021 | 33 | 19 | 9 | 0 | 3 | 3 | 2[a] | Labour lose to no overall control |
| 2022 | 36 | 18 | 8 | 0 | 3 | 4 | 0 | Labour gain from no overall control |
| 2023 | 39 | 18 | 8 | 0 | 3 | 1 | 0 | Labour hold |
- 1998 Kirklees Metropolitan Borough Council election
- 1999 Kirklees Metropolitan Borough Council election
- 2000 Kirklees Metropolitan Borough Council election
- 2002 Kirklees Metropolitan Borough Council election
- 2003 Kirklees Metropolitan Borough Council election
- 2004 Kirklees Metropolitan Borough Council election (new ward boundaries)[37]
- 2006 Kirklees Metropolitan Borough Council election
- 2007 Kirklees Metropolitan Borough Council election
- 2008 Kirklees Metropolitan Borough Council election
- 2010 Kirklees Metropolitan Borough Council election
- 2011 Kirklees Metropolitan Borough Council election
- 2012 Kirklees Metropolitan Borough Council election
- 2014 Kirklees Metropolitan Borough Council election
- 2015 Kirklees Metropolitan Borough Council election
- 2016 Kirklees Metropolitan Borough Council election
- 2018 Kirklees Metropolitan Borough Council election
- 2019 Kirklees Metropolitan Borough Council election
- 2021 Kirklees Metropolitan Borough Council election
- 2022 Kirklees Metropolitan Borough Council election
- 2023 Kirklees Metropolitan Borough Council election
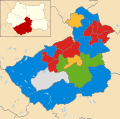
District result maps
-
 2004 results map
 -
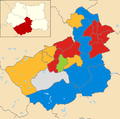
 2006 results map
 -
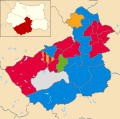
 2007 results map
 -
 2008 results map
 -
 2010 results map
 -
 2011 results map
 -
 2012 results map
 -
 2014 results map
 -
 2015 results map
 -
 2016 results map
 -
 2018 results map
 -
 2019 results map
 -
 2021 results map
 -
 2022 results map
 -
 2023 results map


By-election results
1994-1998
| Party | Candidate | Votes | % | ±% | |
|---|---|---|---|---|---|
| Labour | 1,558 | 48.9 | |||
| Liberal Democrats | 1,179 | 37.0 | |||
| Conservative | 375 | 11.7 | |||
| Green | 73 | 2.3 | |||
| Majority | 377 | 11.9 | |||
| Turnout | 3,185 | ||||
| Labour hold | Swing | ||||
| Party | Candidate | Votes | % | ±% | |
|---|---|---|---|---|---|
| Liberal Democrats | 2,077 | 50.6 | |||
| Labour | 1,418 | 34.5 | |||
| Conservative | 486 | 11.8 | |||
| Green | 124 | 3.0 | |||
| Majority | 659 | 16.1 | |||
| Turnout | 4,105 | 38.2 | |||
| Liberal Democrats hold | Swing | ||||
| Party | Candidate | Votes | % | ±% | |
|---|---|---|---|---|---|
| Labour | 1,219 | 55.5 | +1.7 | ||
| Conservative | 710 | 32.3 | -3.5 | ||
| Liberal Democrats | 268 | 12.2 | +6.2 | ||
| Majority | 509 | 23.2 | |||
| Turnout | 2,197 | 16.0 | |||
| Labour gain from Conservative | Swing | ||||
1998-2002
| Party | Candidate | Votes | % | ±% | |
|---|---|---|---|---|---|
| Liberal Democrats | 1,236 | 43.8 | +31.3 | ||
| Labour | 1,039 | 36.8 | -16.6 | ||
| Conservative | 456 | 16.2 | -9.2 | ||
| Socialist Labour | 90 | 3.2 | +0.3 | ||
| Majority | 197 | 7.0 | |||
| Turnout | 2,821 | 25.1 | |||
| Liberal Democrats gain from Labour | Swing | ||||
| Party | Candidate | Votes | % | ±% | |
|---|---|---|---|---|---|
| Liberal Democrats | 1,174 | 43.4 | -13.1 | ||
| Labour | 976 | 36.0 | +13.3 | ||
| Conservative | 518 | 19.1 | +3.4 | ||
| Socialist | 40 | 1.5 | +1.5 | ||
| Majority | 198 | 7.4 | |||
| Turnout | 2,708 | 21.4 | |||
| Liberal Democrats hold | Swing | ||||
| Party | Candidate | Votes | % | ±% | |
|---|---|---|---|---|---|
| Conservative | 3,176 | 41.2 | -14.6 | ||
| Labour | 2,892 | 37.5 | +3.8 | ||
| Liberal Democrats | 1,651 | 21.4 | +13.6 | ||
| Majority | 284 | 3.7 | |||
| Turnout | 7,719 | ||||
| Liberal Democrats hold | Swing | ||||
2002-2006
| Party | Candidate | Votes | % | ±% | |
|---|---|---|---|---|---|
| BNP | David Exley | 1,607 | 27.7 | +27.7 | |
| Liberal Democrats | Tabasum Aslam | 1,493 | 25.8 | +3.9 | |
Independent
|
Tim Crowther | 1,147 | 19.8 | +19.8 | |
| Labour | Florence Smith | 982 | 16.9 | -22.9 | |
| Conservative | Roger Roberts | 490 | 8.5 | -22.9 | |
| Green | Heidi Smithson | 76 | 1.3 | -5.6 | |
| Majority | 114 | 1.9 | |||
| Turnout | 5,795 | 43.8 | |||
| BNP gain from Labour | Swing | ||||
2006-2010
| Party | Candidate | Votes | % | ±% | |
|---|---|---|---|---|---|
| Labour | Barbara Jones | 2,904 | 63.5 | +6.5 | |
| Liberal Democrats | John O'Reilly | 814 | 17.8 | -0.7 | |
| Conservative | Paul Murphy | 287 | 6.3 | -4.1 | |
| Green | Paul Cooney | 240 | 5.3 | -2.1 | |
Respect
|
David Ellis | 178 | 3.9 | +3.9 | |
| BNP | Barry Fowler | 148 | 3.2 | -3.5 | |
| Majority | 2,090 | 45.7 | |||
| Turnout | 4,571 | 35.1 | |||
| Labour hold | Swing | ||||
| Party | Candidate | Votes | % | ±% | |
|---|---|---|---|---|---|
| Labour | Peter Daniel McBride | 1,397 | 40.5 | +10.0 | |
| Liberal Democrats | Alison Louise Munro | 1,155 | 33.5 | -0.8 | |
| Conservative | Martin James Leonard | 605 | 17.5 | -1.9 | |
| BNP | Jonathan David Baxter Wright | 157 | 4.5 | -6.3 | |
| Green | David William Hargreaves | 103 | 3.0 | -2.0 | |
Independent
|
Colin Anthony Walder | 34 | 1.0 | +1.0 | |
| Majority | 242 | 7.0 | |||
| Turnout | 3,451 | 27.5 | |||
| Labour hold | Swing | ||||
| Party | Candidate | Votes | % | ±% | |
|---|---|---|---|---|---|
| Labour | Cathy Scott | 1,513 | 37.4 | -2.0 | |
| Liberal Democrats | Dennis Hullock | 1,405 | 34.8 | +14.3 | |
| BNP | Joe Barber | 690 | 17.1 | -10.6 | |
| Conservative | Amelia Lynne Bolton | 345 | 8.5 | -3.9 | |
| Green | Adrian Hugh Cruden | 58 | 1.4 | N/A | |
Independent
|
Safiq Ali Patel | 17 | 0.4 | N/A | |
Independent
|
Alan Girvan | 15 | 0.4 | N/A | |
| Majority | 108 | 2.7 | |||
| Turnout | 4,043 | 31.0 | |||
| Labour gain from BNP | Swing | ||||
2010-2014
| Party | Candidate | Votes | % | ±% | |
|---|---|---|---|---|---|
| Labour | Simon Alvy | 1,517 | 43.4 | ||
| Conservative | Sharon Light | 1.378 | 39.4 | ||
| Liberal Democrats | Richard Farnhill | 599 | 17.1 | ||
| Majority | 139 | 4.0 | |||
| Turnout | 3,494 | 25.3 | |||
| Labour gain from Conservative | Swing | ||||
| Party | Candidate | Votes | % | ±% | |
|---|---|---|---|---|---|
| Liberal Democrats | Christine Mary Iredale | 1,591 | 47.6 | ||
| Labour | Stephan Georg Jungnitz | 901 | 27.0 | ||
UKIP
|
Gregory Lloyd Broome | 450 | 13.5 | ||
| Green | Daniel Edward Greenwood | 210 | 6.3 | ||
| Conservative | Clinton Noel Simpson | 189 | 5.7 | ||
| Majority | 690 | 20.7 | |||
| Turnout | 3,341 | 23.0 | |||
| Liberal Democrats gain from Labour | Swing | ||||
2014-2018
| Party | Candidate | Votes | % | ±% | |
|---|---|---|---|---|---|
| Labour | Habiban Nisa Zaman | 2,640 | 76.8 | ||
| Conservative | Paul Young | 443 | 12.9 | ||
Independent
|
Aleks Lukic | 140 | 4.1 | ||
| Liberal Democrats | Jon Robert Bloom | 136 | 4.0 | ||
| Green | David Michael Smith | 70 | 2.0 | ||
| Majority | 2,197 | 63.9 | |||
| Turnout | 3,437 | 25.9 | |||
| Labour hold | Swing | ||||
2018-2022
| Party | Candidate | Votes | % | ±% | |
|---|---|---|---|---|---|
| Labour | Will Simpson | 1,834 | 46.7 | ||
| Conservative | Paula Kemp | 1,689 | 43.0 | ||
| Liberal Democrats | Alison Baskeyfield | 289 | 7.4 | ||
| Green | Isabel Walters | 116 | 3.0 | ||
| Majority | 145 | 3.7 | |||
| Turnout | 3,928 | ||||
| Labour gain from Conservative | Swing | ||||
| Party | Candidate | Votes | % | ±% | |
|---|---|---|---|---|---|
| Conservative | Donna Bellamy | 4,504 | 45.8 | ||
| Labour | Duggs Carre | 3,308 | 46.7 | ||
| Liberal Democrats | Robert Iredale | 1,386 | 14.1 | ||
| Green | Ian Vincent | 646 | 6.6 | ||
| Majority | 1,196 | 12.1 | |||
| Turnout | 9,844 | ||||
| Conservative gain from Labour | Swing | ||||
| Party | Candidate | Votes | % | ±% | |
|---|---|---|---|---|---|
| Labour | Eric Firth | 3,299 | 42.0 | ||
| Conservative | Keith Mallinson | 2,669 | 33.9 | ||
| Heavy Woollen Independents | Ian Vincent | 1,515 | 19.3 | ||
| Liberal Democrats | Dennis Hullock | 380 | 4.8 | ||
| Majority | 630 | 8.0 | |||
| Turnout | 7,863 | ||||
| Labour hold | Swing | ||||
2022-2026
| Party | Candidate | Votes | % | ±% | |
|---|---|---|---|---|---|
| Labour | Ebrahim Dockrat | 2,248 | 73.7 | +29.4 | |
| Conservative | Beverley Smith | 413 | 13.5 | -30.5 | |
| Liberal Democrats | Stephen Long | 178 | 5.8 | -0.1 | |
| Green | Simon Duffy | 145 | 4.8 | -3.9 | |
| Yorkshire | Bikatshi Katenga | 42 | 1.4 | +1.4 | |
| SDP | Mark Steele | 24 | 0.8 | +0.8 | |
| Majority | 1,835 | 60.2 | |||
| Turnout | 3,050 | ||||
| Labour hold | Swing | ||||
Notes
- ^ 1 Heavy Woollen District Independents and 1 Dewsbury Borough Independents.
References
- ^ "The Borough of Kirklees (Electoral Changes) Order 2003", legislation.gov.uk, The National Archives, SI 2003/3091, retrieved 18 June 2023
- ^ "Three major parties find cause for satisfaction in local election results despite low poll". The Times. 14 May 1973.
- ^ "Tories capture 199 seats in 'big cities' poll triumph, May Day blow to Labour as the Tories make many gains in district council elections". The Times. 2 May 1975.
- ^ "Tories seize cities but fail to achieve expected landslide". The Times. 7 May 1976.
- ^ "Power shift in only eight of 80 councils outside London". The Times. 6 May 1978. p. 3.
- ^ Whitaker's Almanac, 1980
- ^ "Labour makes gains throughout Britain in local government elections". The Times. 2 May 1980. p. 4.
- ^ "How the councils fared". The Times. 8 May 1982. p. 2.
- ^ "Conservative candidates hold ground as Alliance bandwagon falters". The Times. 7 May 1982. p. 2.
- ^ "How votes were cast in local government elections". The Times. 7 May 1983. p. 4.
- ^ "Labour captures Birmingham, Tories hold Birmingham". The Times. 6 May 1983. p. 4.
- ^ "How the main parties fared in Britain's local elections". The Times. 10 May 1986.
- ^ "Results in Thiursday's local elections". The Times. 9 May 1987.
- ^ "The gains and losses: Council election results in full". The Times. 7 May 1988.
- ^ "Local election results". The Times. 5 May 1990.
- ^ "Local election results 1992". The Times. 9 May 1992. p. 6.
- ^ "Local elections: Tories lose 18 councils in worst poll performance". The Guardian. 7 May 1994. p. 4.
- ^ "Complete list of results from Thursday's local elections". The Times. 6 May 1995. p. 10.
- ^ "Complete list of results". The Times. 4 May 1996. p. 8.
- ^ "Local election results". The Times. 9 May 1998. p. 46.
- ^ "How Britain voted: Council election results". The Independent. 8 May 1999. p. 12.
- ^ "Election results: Local councils". The Times. 6 May 2000. p. 10.
- ^ "Election results: Local councils". The Times. 4 May 2002. p. 16.
- ^ "Election results". Financial Times. 3 May 2003. p. 8.
- ^ "Local elections 2004 - Election summary". Voting and elections. Kirklees Council. April 2007. Archived from the original on 5 December 2008. Retrieved 15 February 2009.
- ^ "Local elections 2006 - Election summary". Voting and elections. Kirklees Council. April 2007. Retrieved 9 May 2016.[permanent dead link]
- ^ "Local elections 2007 - Election summary". Voting and elections. Kirklees Council. April 2007. Archived from the original on 12 February 2012. Retrieved 8 May 2016.
- ^ "Results for the 01 May 2008 District Council Election". Kirklees Council. May 2008. Retrieved 15 February 2009.[dead link]
- ^ "Local elections 2010 - Election summary". Voting and elections. Kirklees Council. April 2007. Retrieved 8 May 2016.
- ^ "Local elections 2010 - Election summary". Voting and elections. Kirklees Council. April 2007. Retrieved 8 May 2016.
- ^ "Local elections 2012 - Election summary". Voting and elections. Kirklees Council. April 2007. Retrieved 8 May 2016.
- ^ "Local elections 2014 - Election summary". Voting and elections. Kirklees Council. April 2007. Retrieved 8 May 2016.
- ^ "Local elections 2015 - Election summary". Voting and elections. Kirklees Council. April 2007. Retrieved 8 May 2016.
- ^ "Local elections 2016 - Election summary". Voting and elections. Kirklees Council. April 2007. Retrieved 8 May 2016.
- ^ "Local elections 2018 - Election summary". Voting and elections. Kirklees Council. April 2007. Retrieved 7 May 2018.
- ^ "Local elections 2019 - Election summary". Voting and elections. Kirklees Council. May 2019. Retrieved 2 May 2019.
- ^ "The Borough of Kirklees (Electoral Changes) Order 2003", legislation.gov.uk, The National Archives, SI 2003/3091, retrieved 18 March 2024
- ^ "District council, Heckmondwike by-election result, 14 August 2003". Kirklees Council. Retrieved 6 August 2016.
- ^ "District council, Greenhead by-election result, 27 July 2006". Kirklees Council. Retrieved 6 August 2016.
- ^ "District council, Dalton by-election result, 10 July 2008". Kirklees Council. Retrieved 6 August 2016.
- ^ "District council, Dewsbury East by-election result, 16 October 2008". Kirklees Council. Retrieved 1 August 2016.
- ^ "Liversedge and Gomersal, 2013". EnglishElections. Archived from the original on 4 August 2016. Retrieved 15 August 2017.
- ^ "District council, Golcar by-election result, 21 November 2013". Kirklees Council. Retrieved 1 August 2016.
- ^ "District council, Batley East by-election result, 26 October 2017" (PDF). Kirklees Council. Retrieved 27 December 2017.
- ^ "Local Elections Archive Project — Denby Dale Ward". www.andrewteale.me.uk. Retrieved 19 April 2022.
- ^ "Local Elections Archive Project — Colne Valley Ward". www.andrewteale.me.uk. Retrieved 19 April 2022.
- ^ "Local Elections Archive Project — Dewsbury West Ward". www.andrewteale.me.uk. Retrieved 19 April 2022.
- ^ "Local Elections Archive Project — Batley East Ward". www.andrewteale.me.uk. Retrieved 19 April 2022.
External links
| Mayor | |
|---|---|
| Bradford | |
| Calderdale | |
| Kirklees | |
| Leeds |
|
| Wakefield | |
| West Yorkshire CC | |
| West Riding CC | |
| |
