
2017 United Kingdom general election in England
| |||||||||||||||||||||||||||||||||||||||||||||||||
| Turnout | 69.1% ( | ||||||||||||||||||||||||||||||||||||||||||||||||
|---|---|---|---|---|---|---|---|---|---|---|---|---|---|---|---|---|---|---|---|---|---|---|---|---|---|---|---|---|---|---|---|---|---|---|---|---|---|---|---|---|---|---|---|---|---|---|---|---|---|
| |||||||||||||||||||||||||||||||||||||||||||||||||
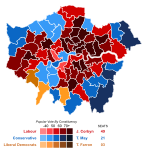
 A map of English parliamentary constituencies *Seat figure does not include Speaker of the House of Commons John Bercow, who was included in the Conservative seat total by some media outlets. | |||||||||||||||||||||||||||||||||||||||||||||||||


.jpg)
The 2017 United Kingdom general election in England was held on Thursday 8 June 2017 across 533 constituencies within England.
Results summary
| Party[2] | Seats | Votes | |||||||
|---|---|---|---|---|---|---|---|---|---|
| Total | Gains | Losses | Net +/- | % seats | Total votes | % votes | Change | ||
| Conservative | 296 | 8 | 30 | 55.5 | 12,344,901 | 45.4 | |||
| Labour | 227 | 27 | 6 | 42.6 | 11,390,099 | 41.9 | |||
| Liberal Democrats | 8 | 5 | 3 | 1.5 | 2,121,810 | 7.8 | |||
UKIP
|
0 | 0 | 1 | — | 557,390 | 2.1 | |||
| Green | 1 | 0 | 0 | 0.2 | 506,969 | 1.9 | |||
| Speaker | 1 | 0 | 0 | 0.2 | 34,299 | 0.1 | |||
| Yorkshire | 0 | 0 | 0 | — | 20,958 | 0.1 | |||
| NHA | 0 | 0 | 0 | — | 16,119 | 0.1 | |||
| CPA | 0 | 0 | 0 | — | 5,869 | 0.0 | |||
| BNP | 0 | 0 | 0 | — | 4,642 | 0.0 | |||
| Monster Raving Loony | 0 | 0 | 0 | — | 3,733 | 0.0 | |||
| Women's Equality | 0 | 0 | 0 | — | 3,066 | 0.0 | |||
| English Democrat | 0 | 0 | 0 | — | 1,913 | 0.0 | |||
| Pirate | 0 | 0 | 0 | — | 1,875 | 0.0 | |||
| Workers Revolutionary | 0 | 0 | 0 | — | 771 | 0.0 | |||
SDP
|
0 | 0 | 0 | — | 321 | 0.0 | |||
| Others | 0 | 0 | 0 | — | 151,054 | 0.6 | |||
| Total | 533 | 27,165,789 | Turnout | 69.1 | |||||
Analysis
The Conservatives retained a majority of seats in England, though with a net loss of 23 seats. They also increased their share of the vote to their highest since 1987.
The Labour Party substantially increased their share of the vote and made gains for the first time since 2001, but did not overtake the Conservatives. Labour received its highest share of the vote in England since 1997.
The
UKIP saw their share of the vote collapse to almost negligible levels. They failed to gain any new seats and their one success from 2015, Clacton, returned to Conservative control.[4] Paul Nuttall resigned as party leader on 9 June 2017 after finishing in third place at Boston and Skegness.[5]
The Green Party decreased its share of the vote and failed to make any gains, but retained Brighton Pavilion. The party deliberately chose not to contest many seats, in order to give Labour an increased chance of winning over Conservative candidates.
Regional results
Regional vote shares and changes are sourced from Britain Elects.
East Midlands
| Party | Seats | Votes | |||||||
|---|---|---|---|---|---|---|---|---|---|
| Total | Gains | Losses | Net +/- | % seats | Total votes | % votes | Change | ||
| Conservative | 31 | 2 | 3 | 67.4 | 1,195,983 | 50.8 | |||
| Labour | 15 | 3 | 2 | 32.6 | 952,295 | 40.5 | |||
| Liberal Democrats | 0 | 0 | 0 | — | 101,612 | 4.3 | |||
UKIP
|
0 | 0 | 0 | — | 56,358 | 2.4 | |||
| Green | 0 | 0 | 0 | — | 34,355 | 1.5 | |||
| Others | 0 | 0 | 0 | — | 13,247 | 0.6 | — | ||
| Total | 46 | 2,353,850 | 69.0 | ||||||
-
 East Midlands
.svg)
East of England
| Party | Seats | Votes | |||||||
|---|---|---|---|---|---|---|---|---|---|
| Total | Gains | Losses | Net +/- | % seats | Total votes | % votes | Change | ||
| Conservative | 50 | 1 | 3 | 86.2 | 1,690,813 | 54.7 | |||
| Labour | 7 | 3 | 0 | 12.1 | 1,012,359 | 32.8 | |||
| Liberal Democrats | 1 | 0 | 0 | 1.7 | 244,064 | 7.9 | |||
UKIP
|
0 | 0 | 1 | — | 77,793 | 2.5 | |||
| Green | 0 | 0 | 0 | — | 58,684 | 1.9 | |||
| Others | 0 | 0 | 0 | — | 6,262 | 0.2 | |||
| Total | 58 | 3,089,966 | |||||||
-
 East of England
.svg)
London
| Party | Seats | Votes | |||||||
|---|---|---|---|---|---|---|---|---|---|
| Total | Gains | Losses | Net +/- | % seats | Total votes | % votes | Change | ||
| Labour | 49 | 4 | 0 | 67.1 | 2,087,010 | 54.6 | |||
| Conservative | 21 | 0 | 6 | 28.8 | 1,268,800 | 33.2 | |||
| Liberal Democrats | 3 | 2 | 0 | 4.1 | 336,680 | 8.8 | |||
| Green | 0 | 0 | 0 | — | 67,579 | 1.8 | |||
UKIP
|
0 | 0 | 0 | — | 49,369 | 1.3 | |||
| Others | 0 | 0 | 0 | — | 11,795 | 0.3 | |||
| Total | 73 | 3,821,233 | |||||||
-
 London
.svg)
North East England
| Party | Seats | Votes | |||||||
|---|---|---|---|---|---|---|---|---|---|
| Total | Gains | Losses | Net +/- | % seats | Total votes | % votes | Change | ||
| Labour | 26 | 1 | 1 | 89.7 | 709,838 | 55.6 | |||
| Conservative | 3 | 1 | 1 | 10.3 | 440,613 | 34.5 | |||
| Liberal Democrats | 0 | 0 | 0 | — | 58,409 | 4.6 | |||
UKIP
|
0 | 0 | 0 | — | 49,348 | 3.9 | |||
| Green | 0 | 0 | 0 | — | 16,080 | 1.3 | |||
| Others | 0 | 0 | 0 | — | 2,053 | 0.2 | |||
| 29 | 1,276,341 | ||||||||
-
 North East England
.svg)
North West England
| Party | Seats | Votes | |||||||
|---|---|---|---|---|---|---|---|---|---|
| Total | Gains | Losses | Net +/- | % seats | Total votes | % votes | Change | ||
| Labour | 54 | 4 | 1 | 72.0 | 1,972,682 | 55.0 | |||
| Conservative | 20 | 2 | 4 | 26.7 | 1,301,562 | 36.3 | |||
| Liberal Democrats | 1 | 0 | 1 | 1.3 | 193,197 | 5.4 | |||
UKIP
|
0 | 0 | 0 | — | 68,946 | 1.9 | |||
| Green | 0 | 0 | 0 | — | 39,169 | 1.1 | |||
| Others | 0 | 0 | 0 | — | 11,283 | 0.3 | |||
| 75 | 3,586,839 | ||||||||
-
 North West England
.svg)
In
South East England
| Party | Seats | Votes | |||||||
|---|---|---|---|---|---|---|---|---|---|
| Total | Gains | Losses | Net +/- | % seats | Total votes | % votes | Change | ||
| Conservative | 72 | 0 | 6 | 85.7 | 2,529,574 | 54.8 | |||
| Labour | 8 | 4 | 0 | 9.5 | 1,326,279 | 28.6 | |||
| Liberal Democrats | 2 | 2 | 0 | 2.4 | 487,243 | 10.6 | |||
| Green | 1 | 0 | 0 | 1.2 | 145,171 | 3.1 | |||
UKIP
|
0 | 0 | 0 | — | 103,509 | 2.2 | |||
| Speaker | 1 | 0 | 0 | 1.2 | 11,283 | 0.3 | |||
| Others | 0 | 0 | 0 | — | 23,914 | 0.5 | |||
| 84 | 4,610,052 | ||||||||
-
 South East England
.svg)
Of the eight constituencies in
No seats changed allegiance in Buckinghamshire. Commons leader Dr David Lidington, veterans minister Lieutenant Colonel Mark Lancaster and former attorney-general Dominic Grieve were re-elected. John Bercow, speaker of the House of Commons, returned in Buckingham uncontested by the main political parties.
In
Labour gained
In
For the fourth general election in a row the Conservatives made a clean sweep of Surrey. Prisons undersecretary Sam Gyimah, transport secretary Chris Grayling, deputy chief whip Anne Milton, chancellor Philip Hammond, health secretary Jeremy Hunt and former lord chancellor Michael Gove all held their seats here.
South West England
| Party | Seats | Votes | |||||||
|---|---|---|---|---|---|---|---|---|---|
| Total | Gains | Losses | Net +/- | % seats | Total votes | % votes | Change | ||
| Conservative | 47 | 0 | 4 | 85.5 | 1,539,618 | 51.5 | |||
| Labour | 7 | 3 | 0 | 12.7 | 870,561 | 29.1 | |||
| Liberal Democrats | 1 | 1 | 0 | 1.8 | 446,181 | 14.9 | |||
| Green | 0 | 0 | 0 | — | 66,176 | 2.2 | |||
UKIP
|
0 | 0 | 0 | — | 32,944 | 1.1 | |||
| Others | 0 | 0 | 0 | — | 32,649 | 1.1 | |||
| 55 | 2,988,129 | ||||||||
-
 South West England
.svg)
The combined representation of Labour and the Liberal Democrats doubled compared to 2015, but the Conservatives still had a landslide and also increased their vote share to an outright majority.
In Cornwall the Conservatives held all six constituencies, re-electing junior ministers George Eustice and Sarah Newton.
In
In
The Conservatives held five seats in
The five Somerset constituencies were all held by the Conservatives. Tessa Munt attempted unsuccessfully to regain Wells from James Heappey.
The Conservatives also held all seven seats in
West Midlands
| Party | Seats | Votes | |||||||
|---|---|---|---|---|---|---|---|---|---|
| Total | Gains | Losses | Net +/- | % seats | Total votes | % votes | Change | ||
| Conservative | 35 | 2 | 1 | 59.3 | 1,355,468 | 49.1 | |||
| Labour | 24 | 1 | 2 | 40.7 | 1,175,075 | 42.6 | |||
| Liberal Democrats | 0 | 0 | 0 | — | 122,287 | 4.4 | |||
UKIP
|
0 | 0 | 0 | — | 50,106 | 1.8 | |||
| Green | 0 | 0 | 0 | — | 45,208 | 1.6 | |||
| Others | 0 | 0 | 0 | — | 13,236 | 0.5 | |||
| 59 | 2,761,380 | ||||||||
-
 West Midlands
.svg)
The Conservatives increased their majority and Labour fell back slightly. Both parties increased their share of the popular vote. The Liberal Democrats and Greens failed to make any improvement on the 2015 result, while UKIP saw its support collapse.
In the ceremonial county of West Midlands Labour won twenty seats and the Conservatives won eight.
The Conservatives made a clean sweep of Worcestershire for the third consecutive election. Their six MPs included communities secretary Sajid Javid and three junior ministers (Harriett Baldwin, Robin Walker and Mark Garnier).
The Conservatives also maintained their sweep of
In
In
In Herefordshire Jesse Norman and Bill Wiggin were both returned to Parliament.
Yorkshire and the Humber
| Party | Seats | Votes | |||||||
|---|---|---|---|---|---|---|---|---|---|
| Total | Gains | Losses | Net +/- | % seats | Total votes | % votes | Change | ||
| Labour | 37 | 4 | 0 | 59.3 | 1,275,800 | 49.1 | |||
| Conservative | 17 | 0 | 2 | 40.7 | 1,054,099 | 40.6 | |||
| Liberal Democrats | 0 | 0 | 2 | — | 129,637 | 5.0 | |||
UKIP
|
0 | 0 | 0 | — | 67,801 | 2.6 | |||
| Green | 0 | 0 | 0 | — | 32,743 | 1.3 | |||
| Others | 0 | 0 | 0 | — | 36,507 | 1.4 | |||
| 54 | 2,596,587 | ||||||||
All seats in the region went to the two main parties: Labour increasing their dominance, the Conservatives falling back slightly, and the Liberal Democrats being swept away. UKIP had polled strongly in 2015 but this year declined to insignificance. The Green Party continued to have negligible presence.
All three
In the East Riding of Yorkshire, the four Conservative MPs (David Davis, Graham Stuart, Greg Knight and Andrew Percy) were all re-elected with substantially increased shares of the vote.
Labour made a clean sweep across
In West Yorkshire five Conservatives (Craig Whittaker, Alec Shelbrooke, Andrea Jenkyns, Stuart Andrew and Philip Davies) were re-elected. Two others (Jason McCartney and Kris Hopkins) were defeated by Labour, as was the only Liberal Democrat Greg Mulholland. Labour held the fourteen seats it had won in 2015, returning shadow Lord Chancellor Richard Burgon and leadership contender Yvette Cooper as well as actress Tracy Brabin who had been elected the previous autumn following the murder of Jo Cox.
No constituencies changed allegiance in North Yorkshire: Labour's Rachael Maskell was re-elected in York Central while all seven other seats were held by the Conservatives, including vice-chamberlain and junior whip Julian Smith and transport minister Andrew Jones.
In North and North East Lincolnshire Nic Dakin and Martin Vickers were both re-elected. Melanie Onn also won re-election in Great Grimsby.[6]
Donations
Electoral commission data shows that in 2017 Q2, total donations for each major political party, over £7,500, are as follows:[7]
| Party | Donations | |
|---|---|---|
| Conservative | £25,346,680 | |
| Labour | £9,745,745 | |
| Liberal Democrats | £5,058,175 | |
Endorsements
See also
- 2017 United Kingdom general election in Northern Ireland
- 2017 United Kingdom general election in Scotland
- 2017 United Kingdom general election in Wales
References
- ^ Election 2017 United Kingdom - National Results BBC News
- ^ "England Results". BBC News.
- ISSN 0261-3077. Retrieved 5 May 2020.
- ^ Lodge, Will (9 June 2017). "General election 2017: Conservative Giles Watling re-takes Clacton for his party". East Anglian Daily Times. Retrieved 1 October 2020.
- ^ "Ukip vote collapses as Paul Nuttall fails to win Boston and Skegness". BT.com. Retrieved 5 May 2020.
- ^ "Great Grimsby parliamentary constituency - Election 2017". BBC News. Retrieved 23 April 2018.
- ^ "Donations accepted". Electoral Commission. Retrieved 3 April 2020.