
Alzheimer's Disease Neuroimaging Initiative
Alzheimer's Disease Neuroimaging Initiative (ADNI) is a multisite study that aims to improve clinical trials for the prevention and treatment of
Primary goals
- Detect the earliest signs of AD and to track the disease using biomarkers.
- validate, standardize, and optimize biomarkers for clinical AD trials.
- to make all data and samples available for sharing with clinical trial designers and scientists worldwide.
History and funding
The idea of a collaboration between public institutions and private pharmaceutical companies to fund a large biomarker project to study AD and to speed up progress toward effective treatments for the disease was conceived at the beginning of the millennium by Neil S. Buckholz at the National Institute on Aging (NIA) and Dr. William Potter, at Eli Lilly and Company.[1] The Alzheimer's Disease Neuroimaging Initiative (ADNI) began in 2004 under the leadership of Dr. Michael W. Weiner, funded as a private – public partnership with $27 million contributed by 20 companies and two foundations through the Foundation for the National Institutes of Health and $40 million from the NIA. The initial five-year study (ADNI-1) was extended by two years in 2009 by a Grant Opportunities grant, and in 2011 and 2016 by further competitive renewals of the ADNI-1 grant (ADNI-2 and ADNI-3, respectively)[7] (Table 1).
Enrollment of participants
ADNI enrolls participants between the ages of 55 and 90 who are recruited at 57 sites in the US and Canada. One group has dementia due to AD, another group has mild memory problems known as mild cognitive impairment (MCI), and the final control group consists of healthy elderly participants. ADNI-1 initially enrolled 200 healthy elderly, 400 participants with MCI, and 200 participants with AD.[6] ADNI-GO, ADNI-2 and ADNI -3 added additional participants to augment the cohort, for final cohort size of over 1000 participants[7] (Table 1).
Table 1:
| Study characteristics | ADNI-1 | ADNI-GO | ADNI-2 | ADNI-3 |
|---|---|---|---|---|
| Primary goal | Developed biomarkers as outcome measures for clinical trials | Examine biomarkers in earlier stages of disease | Develop biomarkers as predictors of cognitive decline, and as outcome measures | Study the use of tau PET and functional imaging techniques and clinical trials |
| Funding | $40 million federal (NIA), $27 million industry and foundation | $24 million American Recovery Act funds | $40 million federal (NIA), $27 million industry and foundation | $40 million federal (NIA), $20 million industry and foundation |
| Duration/start date | 5 years/October 2004 | 2 years/September 2009 | 5 years/September 2011 | 5 years/September 2016 |
| Cohort | 200 elderly controls
400 MCI 200 AD |
Existing ADNI-1 +
200 early MCI |
Existing ADNI-GO+
150 elderly controls 100 early MCI 150 late MCI 150 late mild cognitive impairment 150 AD |
Existing ADNI-2 +
133 elderly controls |
Testing of participants
ADNI uses a variety of techniques to study its participants. After obtaining informed consent, participants undergo a series of initial tests that are repeated at intervals over subsequent years (Table 2):[2]
- a clinical evaluation to assess overall health and relevant history such as education
- neuropsychological tests to assess aspects of brain function affected by AD such as memory, executive function, and the ability to perform activities of daily living.
- genetic testing for the major AD genetic risk factor, APOE ε4, the gene for a form of apolipoprotein E, and other studies
- Alzheimer's brain tau tangles.
- Magnetic resonance imaging (MRI) scans to assess brain structure, connectivity, and the extent of white matter disease
- Positron emission tomography (PET) scans to assess how well the brain uses glucose, and the extent of amyloid plaques and tau tangles.
- Neuropathological examination if a participant dies and has consented to autopsy. This definitively diagnoses AD by identifying amyloid plaques and tau tangles, and also notes other common comorbidities.
Table 2
| Study techniques | ADNI-1 | ADNI-GO | ADNI-2 | ADNI-3 |
|---|---|---|---|---|
| Imaging | ||||
| MRI | ||||
| Structural | X | X | X | X |
| Perfusion | X | X | X | |
| Resting state | X | X | X | |
| Diffusion | X | X | X | |
| Connectomics | X | |||
| High resolution | X | |||
| PET | ||||
| Glucose metabolism | X | X | X | |
| β-amyloid | [11C] Pittsburgh compound | [18F] florbetapir | [18F] florbetapir | [18F] florbetapir/Florbetaben |
| Tau | [18F] T807 | |||
| Biosamples | ||||
| CSF β-amyloid, tau | X | X | X | X |
| Genetic analysis | ||||
| APOE | X | X | X | X |
| Genome wide association studies | X | X | X | X |
| Whole genome sequencing | X | X | ||
| Systems biology approaches | X | |||
| Neuropsychological tests | X | X | X | X |
| Autopsy | X | X | X | X |
Data sharing
One defining characteristic of ADNI is the commitment by all participating research groups to share ownership of the data prior to the completion of the research and by collaborators to forgo any patent opportunities. This has been described by the head of the ADNI and data publications committee as "a radical experiment in open data access".[3] All data generated by the ADNI study are entered into the data archive hosted at the Laboratory of NeuroImaging (LONI) at the University of Southern California.[5] In 2013, whole genome sequencing data for the entire ADNI cohort were added to the LONI database.[8] Qualified researchers worldwide can access image and clinical data sets that have undergone quality control procedures. To date nearly 1800 applications for data use have been received from investigators in multiple disciplines, and over 7 million brain scan images and clinical data sets have been downloaded.[9]
ADNI contributes data to a number of consortia and big data projects which have the potential to unlock many of the mysteries of neurological diseases.[10] It shares imaging and genetic data with the Enhancing Neuro Imaging Genetics through Meta-Analysis (ENIGMA) consortium which uses imaging genetics to study 12 major brain diseases including schizophrenia, bipolar disease and depression.[11] The ADNI dataset was also used as the "test" dataset in the Dialogue on Reverse Engineering Assessment and Methods (DREAM) Alzheimer's disease Big Data Challenge #1 for the discovery of novel predictive AD biomarkers.[12] One measure of the success of this open data sharing approach is the number of scientific publications arising from ADNI data: currently over 1000 and a wide variety of fields including areas outside of Alzheimer's disease.[9]
Development of standardized protocols
ADNI has developed standardized protocols that allow results from multiple centers both within the study and worldwide to be directly compared.[4] These include methods for the acquisition and quality control of both MRI and PET scans on scanners differing in the vendor, software platform, and field strength, and also for the analysis of CSF biomarkers. The standardized methods[13] are now used by pharmaceutical companies, and in clinical trials of preventive and disease modifying AD treatments.
Biomarker trajectories throughout disease progression
An initial goal of ADNI was to understand the development of AD pathology by tracking imaging and CSF biomarkers throughout disease progression[1] according to the amyloid hypothesis.
A model of how different
proposed that biomarkers become abnormal in the following order:- β-amyloid (indicating deposition of amyloid in plaques outside the cell, measured in CSF and by amyloid PET)
- Tau (indicating the formation of tau fibrils with the neurons)
- Glucose metabolism (measured on PET, indicating damage to neurons)
- Structural MRI (indicating damage to brain structure)
- Cognitive impairment
This model has been largely validated using longitudinal ADNI data in patients who have abnormal levels of amyloid deposition,[9][16] consistent with the amyloid hypothesis.
Other significant findings
Studies using ADNI cross-sectional and longitudinal MRI, PET, genetics, cognitive, biological fluid, and autopsy data have reported that:
- AD pathology is already present in people with no outward sign of memory loss. These cognitively normal people may already have subtle brain atrophy.[17][18][19]
- AD progresses in a typical pattern, beginning in the entorhinal cortex in the preclinical AD, spreading to other regions affecting memory, then function and other cognitive abilities in mild to moderate AD and finally severe AD (Figure 1).

- The spread can be seen in patterns of changes in biomarkers of β-amyloid deposition (Figure 2), glucose metabolism (Figure 3) and in structural changes in the brain measured by MRI (Figure 4).[9]

Figure 2: β-amyloid deposition. This image shows a Pittsburgh compound B (PIB)-PET scan of a patient with Alzheimer's disease on the left and an elderly person with normal memory on the right. Areas of red and yellow show high concentrations of PiB in the brain and suggest high amounts of amyloid deposits in these areas. 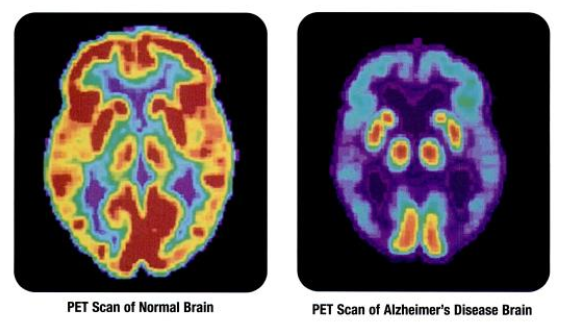
Figure 3: PET scans showing differences in glucose metabolism in a normal brain on the left and the brain of a patient with AD on the right. Red/yellow corresponds to higher metabolism and blue/purple corresponds to lower metabolism, indicating damage to neurons. 
Figure 4. Structural changes in the Alzheimer brain compared to the normal brain include thinning of the cortex, expansion of the ventricles, enlargement of the sulci, and general loss of brain volume. - AD is characterized by the progressive disruption of the brain connectome.[21][22] As the disease progresses there are fewer connections between essential brain regions (Figure 5).

Figure 5. Network representation of brain connectivity. The thickness of the lines represent the strength of connection between different brain areas. Important 'hubs' are marked as circles. As Alzheimer's disease progresses, individual connections erode.[23] - Many genes in addition to APOE ε4 underlie late onset AD. ADNI data has helped to identify or confirm 10 of the approximately 20 risk genes currently identified[24][25]
- Cerebrovascular disease can accelerate disease progression in AD.[26][27][28]
- Both the cognitively normal and MCI groups are pathologically heterogeneous. Some people show no signs of AD, some show signs of progressing to AD quickly, and others show signs of progressing to dementias other than AD.[16][29]


Diagnosis of AD and the prediction of future AD
ADNI data has been used to test many diagnostic and prognostic
Diagnosis
One example [9] of a combination of biomarkers that can accurately diagnose AD is:
- Changes in brain atrophy patterns over time (measured by MRI)
- Levels of β-amyloid and tau (measured in CSF)
A second approach to diagnosis is to extract the most pertinent information from MRI scans alone.[9] Deep learning algorithms can diagnose AD with greater than 95% accuracy,[30][31][32][33][34] and can diagnose MCI due to AD with greater than 82% accuracy.[31][35][36]
As imaging scans are expensive and sometimes unavailable, and the analysis of CSF requires an invasive lumbar puncture procedure, ADNI blood samples are being used to develop diagnostic blood tests for clinical use. These are currently not as accurate as other methods.[37][38]
Prediction
Deep learning algorithms which extract the most pertinent information from MRI scans can also predict the progression of MCI patients to AD several years in advance with accuracies of greater than 90%.[39]
Development of biomarkers for clinical trials
The major aim of ADNI is to develop biomarkers to enable successful clinical trials. AD clinical trials are now focusing on preventing the disease rather than curing it.[40] Because AD pathology develops many years before outward signs of the disease such as memory loss, preventive therapies are targeted to cognitively normal people.[40] ADNI studies have focused on two aspects of clinical trials in particular: 1) how best to select trial participants who don't yet show any signs of cognitive impairment but who are at a high risk of developing AD (subject selection); and 2) how to detect the effect of a therapy (outcome measures).
Subject selection
ADNI studies have shown that people who are β-amyloid positive or have a small hippocampal volume, or carry an APOE ε4 allele are at a higher risk for AD.[9] Therefore, clinical trial participants can be selected using these criteria. (39). Moreover, use of the selection strategy can reduce the number of participants required to detect a treatment effect over feasible trial (for example 3 years).
- β-amyloid positivity. Currently, the phase 3 A4 trial testing the anti-amyloid antibody solanezumab, uses β-amyloid positivity to select elderly participants with no outward signs of AD.[41]
- Hippocampal volume. Hippocampal volume can differentiate between MCI patients who will go on to develop AD from those who are on different disease pathways. This reduces the number of participants required for effective clinical trials.[42] Hippocampal volume is the first imaging biomarker to be qualified, with the help of ADNI data, by the European Medicines Agency to select patients for clinical trials.[42] ADNI also contributed to the development of a standardized technique to manually measure hippocampal volume from MRI scans for use in clinical trials.[43]
- APOE ε4 allele. As this allele is the biggest risk factor for late onset AD, it is commonly used in subject selection.[44]
Outcome measures
In the US, only cognitive tests have been approved as outcome measures for detecting clinical change in AD clinical trials. Studies using ADNI data have helped refine these tests to be more sensitive to very early changes in cognition.[45][46] ADNI is working to develop imaging biomarkers such as various brain atrophy MRI measures as alternative outcome measures to these cognitive tests.[47][48]
Future directions
ADNI-3 will follow current and additional patients with normal cognition, MCI, and AD for a further five years.[7] The approach is unique to the study are:
- Use of web-based methods for cognitive assessment of patients in conjunction with the Brain Health Registry.[49]
- Use of tau PET imaging to determine how tau tangles are related to amyloid levels and to cognition
- Development of tau PET as outcome measure to replace cognitive outcome measures for AD clinical trials
- Use of Human Connectome Project MRI techniques to map the effects of AD on brain connectivity
- Use of Systems biology approaches to understand AD genetics and its relationship to AD biology
- Use of high-powered MRI to detect very early structural brain changes associated with AD in patients with no symptoms.
- Development of models to select participants for AD clinical trials using Precision medicineapproaches
Other studies modeled on ADNI
ADNI's organization, funding structures, standardized methodologies, and open datasharing approaches have been used in a number of different studies.
Alzheimer's disease related
- Worldwide ADNI[50] : documents disease progression in a diverse range of racial and ethnic groups in Europe, Japan, Argentina, South Korea, Australia, China, Italy, and Taiwan with the aim of improving AD clinical trials.
- Department of Defense ADNI: enrolls Vietnam War veterans to examine the link between Funded by the US Department of Defense
- ADNI Depression study: examines the link between late life depression and cognitive impairment.[4]
Other diseases
- Parkinson's Progressive Markers Initiative: aims to identify biomarkers for Parkinson's disease progression and to improve clinical trials for Parkinson's disease therapies.[51][52]
- North American Registry for Care and Research in Multiple Sclerosis: aims to track disease progression in Multiple sclerosis, identify new biomarkers, openly share data, and to ultimately improve clinical trials for Multiple sclerosis therapies.[53]
- Down Syndrome Biomarker Initiative: examines link between Down syndrome and AD.[54]
References
- ^ PMID 16443497.
- ^ PMID 20451868.
- ^ PMID 26194319.
- ^ PMID 26194320.
- ^ PMID 26194316.
- ^ PMID 26073027.
- ^ PMID 27931796.
- ^ Alzforum (4 October 2013). "ADNI Full Genetic Sequences Now Available for Download". www.alzforum.com. Retrieved 1 May 2017.
- ^ PMID 27931796.
- PMID 25217787.
- PMID 24399358.
- ^ "Big Data Challenge for Alzheimer's Disease Launches in Global Effort to Use Innovative Open Science Techniques to Improve Diagnosis and Treatment | Global CEO Initiative on Alzheimer's Disease". Archived from the original on 2017-01-06. Retrieved 2017-01-05.
- ^ "ADNI | Methods & Tools". adni.loni.usc.edu. Retrieved 2017-01-05.
- PMID 20083042.
- PMID 23332364.
- ^ PMID 25012224.
- PMID 26476234.
- PMID 25610772.
- PMID 24176625.
- ^ "About Alzheimer's Disease: Alzheimer's Basics". National Institute on Aging. Retrieved 2017-01-06.
- PMID 23399468.
- PMID 26989936.
- PMID 18597554.
- PMID 24092460.
- PMID 26194313.
- PMID 24821476.
- S2CID 46498867.
- PMID 26119224.
- PMID 26194315.
- S2CID 8856960.
- ^ S2CID 22909643.
- PMID 25320824.
- PMID 26540666.
- PMID 26572145.
- PMID 24911377.
- PMID 25993900.
- S2CID 18280670.
- PMID 25173418.
- PMID 26177419.
- ^ PMID 25079804.
- PMID 24648338.
- ^ PMID 24211008.
- S2CID 205670998.
- PMID 26000325.
- S2CID 29636020.
- PMID 24886908.)
{{cite journal}}: CS1 maint: multiple names: authors list (link - PMID 25437302.
- PMID 25260848.
- ^ "Brain Health Registry". www.brainhealthregistry.org. Retrieved 2017-01-09.
- ^ "World Wide Alzheimer's Disease Neuroimaging Initiative". Alzheimer's Association | Research Center. Archived from the original on 2016-07-01. Retrieved 2017-01-09.
- S2CID 31411505.
- PMID 27240810.
- ^ Rammohan, KW (2014). "Transformation of MS care in the 21st Century. How NARCRMS will change the way we practice". 6th Cooperative Meeting of the Consortium of Multiple Sclerosis Centers in the Americas Committee for Treatment and Research and Multiple Sclerosis.
- S2CID 1422535.
| International | |
|---|---|
| National | |