The infinite-dimensional generalization of the Dirichlet distribution is the Dirichlet process.
Definitions
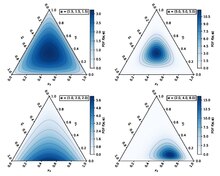
Probability density function
Illustrating how the log of the density function changes when K = 3 as we change the vector α from α = (0.3, 0.3, 0.3) to (2.0, 2.0, 2.0), keeping all the individual 's equal to each other.
The support of the Dirichlet distribution is the set of K-dimensional vectors whose entries are real numbers in the interval [0,1] such that , i.e. the sum of the coordinates is equal to 1. These can be viewed as the probabilities of a K-way
standard (K − 1)-simplex,[3] which is a generalization of a triangle, embedded in the next-higher dimension. For example, with K = 3, the support is an equilateral triangle
embedded in a downward-angle fashion in three-dimensional space, with vertices at (1,0,0), (0,1,0) and (0,0,1), i.e. touching each of the coordinate axes at a point 1 unit away from the origin.
Special cases
A common special case is the symmetric Dirichlet distribution, where all of the elements making up the parameter vector have the same value. The symmetric case might be useful, for example, when a Dirichlet prior over components is called for, but there is no prior knowledge favoring one component over another. Since all elements of the parameter vector have the same value, the symmetric Dirichlet distribution can be parametrized by a single scalar value α, called the concentration parameter. In terms of α, the density function has the form
When α=1[1], the symmetric Dirichlet distribution is equivalent to a uniform distribution over the open
standard (K − 1)-simplex, i.e. it is uniform over all points in its support. This particular distribution is known as the flat Dirichlet distribution. Values of the concentration parameter above 1 prefer variates
that are dense, evenly distributed distributions, i.e. all the values within a single sample are similar to each other. Values of the concentration parameter below 1 prefer sparse distributions, i.e. most of the values within a single sample will be close to 0, and the vast majority of the mass will be concentrated in a few of the values.
More generally, the parameter vector is sometimes written as the product of a (scalar) concentration parameterα and a (vector) base measure where lies within the (K − 1)-simplex (i.e.: its coordinates sum to one). The concentration parameter in this case is larger by a factor of K than the concentration parameter for a symmetric Dirichlet distribution described above. This construction ties in with concept of a base measure when discussing Dirichlet processes and is often used in the topic modelling literature.
^ If we define the concentration parameter as the sum of the Dirichlet parameters for each dimension, the Dirichlet distribution with concentration parameter K, the dimension of the distribution, is the uniform distribution on the (K − 1)-simplex.
More generally, moments of Dirichlet-distributed random variables can be expressed in the following way. For , denote by its -th Hadamard power. Then,[6]
of the parameter is also a Dirichlet. Intuitively, in such a case, starting from what we know about the parameter prior to observing the data point, we then can update our knowledge based on the data point and end up with a new distribution of the same form as the old one. This means that we can successively update our knowledge of a parameter by incorporating new observations one at a time, without running into mathematical difficulties.
Formally, this can be expressed as follows. Given a model
then the following holds:
This relationship is used in
pseudocounts
, i.e. as representing the number of observations in each category that we have already seen. Then we simply add in the counts for all the new observations (the vector c) in order to derive the posterior distribution.
In Bayesian
hierarchical Bayesian models with mixture components, Dirichlet distributions are commonly used as the prior distributions for the categorical variables appearing in the models. See the section on applications
below for more information.
Relation to Dirichlet-multinomial distribution
In a model where a Dirichlet prior distribution is placed over a set of
variational Bayes, Dirichlet prior distributions are often marginalized out. See the article on this distribution
The following formula for can be used to derive the differential
entropy
above. Since the functions are the sufficient statistics of the Dirichlet distribution, the exponential family differential identities can be used to get an analytic expression for the expectation of (see equation (2.62) in [12]) and its associated covariance matrix:
and the information entropy is the limit as goes to 1.
Another related interesting measure is the entropy of a discrete categorical (one-of-K binary) vector with probability-mass distribution , i.e., . The conditional
information entropy
of , given is
This function of is a scalar random variable. If has a symmetric Dirichlet distribution with all , the expected value of the entropy (in nat units) is[14]
Aggregation
If
then, if the random variables with subscripts i and j are dropped from the vector and replaced by their sum,
This aggregation property may be used to derive the marginal distribution of mentioned above.
If , then the vector X is said to be neutral[15] in the sense that XK is independent of [3] where
and similarly for removing any of . Observe that any permutation of X is also neutral (a property not possessed by samples drawn from a generalized Dirichlet distribution).[16]
Combining this with the property of aggregation it follows that Xj + ... + XK is independent of . In fact it is true, further, for the Dirichlet distribution, that for , the pair , and the two vectors and , viewed as triple of normalised random vectors, are mutually independent. The analogous result is true for partition of the indices {1,2,...,K} into any other pair of non-singleton subsets.
Characteristic function
The characteristic function of the Dirichlet distribution is a
The sum is over non-negative integers and . Phillips goes on to state that this form is "inconvenient for numerical calculation" and gives an alternative in terms of a
complex path integral
:
where L denotes any path in the complex plane originating at , encircling in the positive direction all the singularities of the integrand and returning to .
Inequality
Probability density function plays a key role in a multifunctional inequality which implies various bounds for the Dirichlet distribution.[18]
Although the Xis are not independent from one another, they can be seen to be generated from a set of K independent gamma random variable.[19]: 594 Unfortunately, since the sum V is lost in forming X (in fact it can be shown that V is stochastically independent of X), it is not possible to recover the original gamma random variables from these values alone. Nevertheless, because independent random variables are simpler to work with, this reparametrization can still be useful for proofs about properties of the Dirichlet distribution.
Here is a K-dimensional real vector and is a scalar parameter. The domain of is restricted to the set of parameters for which the above unnormalized density function can be normalized. The (necessary and sufficient) condition is:[21]
The conjugation property can be expressed as
if [prior: ] and [observation: ] then [posterior: ].
In the published literature there is no practical algorithm to efficiently generate samples from .
Occurrence and applications
Bayesian models
Dirichlet distributions are most commonly used as the
Inference over hierarchical Bayesian models is often done using Gibbs sampling, and in such a case, instances of the Dirichlet distribution are typically marginalized out of the model by integrating out the Dirichlet random variable. This causes the various categorical variables drawn from the same Dirichlet random variable to become correlated, and the joint distribution over them assumes a Dirichlet-multinomial distribution, conditioned on the hyperparameters of the Dirichlet distribution (the concentration parameters). One of the reasons for doing this is that Gibbs sampling of the Dirichlet-multinomial distribution is extremely easy; see that article for more information.
Intuitive interpretations of the parameters
The concentration parameter
Dirichlet distributions are very often used as
discrete probability distribution, then intuitively the concentration parameter can be thought of as determining how "concentrated" the probability mass of the Dirichlet distribution to its center, leading to samples with mass dispersed almost equally among all components, i.e., with a value much less than 1, the mass will be highly concentrated in a few components, and all the rest will have almost no mass, and with a value much greater than 1, the mass will be dispersed almost equally among all the components. See the article on the concentration parameter
for further discussion.
String cutting
One example use of the Dirichlet distribution is if one wanted to cut strings (each of initial length 1.0) into K pieces with different lengths, where each piece had a designated average length, but allowing some variation in the relative sizes of the pieces. Recall that The values specify the mean lengths of the cut pieces of string resulting from the distribution. The variance around this mean varies inversely with .
Consider an urn containing balls of K different colors. Initially, the urn contains α1 balls of color 1, α2 balls of color 2, and so on. Now perform N draws from the urn, where after each draw, the ball is placed back into the urn with an additional ball of the same color. In the limit as N approaches infinity, the proportions of different colored balls in the urn will be distributed as Dir(α1,...,αK).[22]
For a formal proof, note that the proportions of the different colored balls form a bounded [0,1]K-valued
in mean to a limiting random vector. To see that this limiting vector has the above Dirichlet distribution, check that all mixed moments
agree.
Each draw from the urn modifies the probability of drawing a ball of any one color from the urn in the future. This modification diminishes with the number of draws, since the relative effect of adding a new ball to the urn diminishes as the urn accumulates increasing numbers of balls.
With a source of Gamma-distributed random variates, one can easily sample a random vector from the K-dimensional Dirichlet distribution with parameters . First, draw K independent random samples from Gamma distributions each with density
and then set
[Proof]
The joint distribution of the independently sampled gamma variates, , is given by the product:
Next, one uses a change of variables, parametrising in terms of and , and performs a change of variables from such that . Each of the variables and likewise . One must then use the change of variables formula, in which is the transformation Jacobian. Writing y explicitly as a function of x, one obtains
The Jacobian now looks like
The determinant can be evaluated by noting that it remains unchanged if multiples of a row are added to another row, and adding each of the first K-1 rows to the bottom row to obtain
which can be expanded about the bottom row to obtain the determinant value . Substituting for x in the joint pdf and including the Jacobian determinant, one obtains:
where . The right-hand side can be recognized as the product of a Dirichlet pdf for the and a gamma pdf for . The product form shows the Dirichlet and gamma variables are independent, so the latter can be integrated out by simply omitting it, to obtain:
This formulation is correct regardless of how the Gamma distributions are parameterized (shape/scale vs. shape/rate) because they are equivalent when scale and rate equal 1.0.
From marginal beta distributions
A less efficient algorithm[23] relies on the univariate marginal and conditional distributions being beta and proceeds as follows. Simulate from
Then simulate in order, as follows. For , simulate from
and let
Finally, set
This iterative procedure corresponds closely to the "string cutting" intuition described above.
When α1 = ... = αK = 1, a sample from the distribution can be found by randomly drawing a set of K − 1 values independently and uniformly from the interval [0, 1], adding the values 0 and 1 to the set to make it have K + 1 values, sorting the set, and computing the difference between each pair of order-adjacent values, to give x1, ..., xK.
When each alpha is 1/2 and relationship to the hypersphere
When α1 = ... = αK = 1/2, a sample from the distribution can be found by randomly drawing K values independently from the standard normal distribution, squaring these values, and normalizing them by dividing by their sum, to give x1, ..., xK.
A point (x1, ..., xK) can be drawn uniformly at random from the (K−1)-dimensional
hypersphere (which is the surface of a K-dimensional hyperball
) via a similar procedure. Randomly draw K values independently from the standard normal distribution and normalize these coordinate values by dividing each by the constant that is the square root of the sum of their squares.


![{\displaystyle x_{i}\in [0,1]}](https://wikimedia.org/api/rest_v1/media/math/render/svg/a32830173af0dc0eaf16f580cc75ef2f78b4f15e)


![{\displaystyle \operatorname {E} [X_{i}]={\frac {\alpha _{i}}{\alpha _{0}}}}](https://wikimedia.org/api/rest_v1/media/math/render/svg/dbec98ee7aeb59af97828e7b3e9fa92de937021d)
![{\displaystyle \operatorname {E} [\ln X_{i}]=\psi (\alpha _{i})-\psi (\alpha _{0})}](https://wikimedia.org/api/rest_v1/media/math/render/svg/a864ba2186ba3577dcd095b6b3f608511c668b53)


![{\displaystyle \operatorname {Var} [X_{i}]={\frac {{\tilde {\alpha }}_{i}(1-{\tilde {\alpha }}_{i})}{\alpha _{0}+1}},}](https://wikimedia.org/api/rest_v1/media/math/render/svg/74281baf02f79a7b6c05443a1b82fcca1525f9dc)
![{\displaystyle \operatorname {Cov} [X_{i},X_{j}]={\frac {\delta _{ij}\,{\tilde {\alpha }}_{i}-{\tilde {\alpha }}_{i}{\tilde {\alpha }}_{j}}{\alpha _{0}+1}}}](https://wikimedia.org/api/rest_v1/media/math/render/svg/c5a10465175e4b932c563278e2f8b155dfd4fdbb)


![{\displaystyle \alpha _{i}=E[X_{i}]\left({\frac {E[X_{j}](1-E[X_{j}])}{V[X_{j}]}}-1\right)}](https://wikimedia.org/api/rest_v1/media/math/render/svg/027c83bab1eaa080e4ffb57d8a91db47f2a6c62f)


![{\displaystyle \sum _{i=1}^{K}x_{i}=1{\mbox{ and }}x_{i}\in \left[0,1\right]{\mbox{ for all }}i\in \{1,\dots ,K\}}](https://wikimedia.org/api/rest_v1/media/math/render/svg/152d5f72eba43b544c4c64947fc39a9396509282)


![{\displaystyle \operatorname {E} [X_{i}]={\frac {\alpha _{i}}{\alpha _{0}}},}](https://wikimedia.org/api/rest_v1/media/math/render/svg/37c9aba7bdae5b779bbb3d3fc2de3e5aeb42d294)
![{\displaystyle \operatorname {Var} [X_{i}]={\frac {\alpha _{i}(\alpha _{0}-\alpha _{i})}{\alpha _{0}^{2}(\alpha _{0}+1)}}.}](https://wikimedia.org/api/rest_v1/media/math/render/svg/8c608bbee58907394cddf7cfde0c50e76da86f7a)

![{\displaystyle \operatorname {Cov} [X_{i},X_{j}]={\frac {-\alpha _{i}\alpha _{j}}{\alpha _{0}^{2}(\alpha _{0}+1)}}.}](https://wikimedia.org/api/rest_v1/media/math/render/svg/879523bb546e76e2cdc7b418517ede223515f6bd)


![{\displaystyle \operatorname {E} \left[({\boldsymbol {t}}\cdot {\boldsymbol {X}})^{n}\right]={\frac {n!\,\Gamma (\alpha _{0})}{\Gamma (\alpha _{0}+n)}}\sum {\frac {{t_{1}}^{k_{1}}\cdots {t_{K}}^{k_{K}}}{k_{1}!\cdots k_{K}!}}\prod _{i=1}^{K}{\frac {\Gamma (\alpha _{i}+k_{i})}{\Gamma (\alpha _{i})}}={\frac {n!\,\Gamma (\alpha _{0})}{\Gamma (\alpha _{0}+n)}}Z_{n}({\boldsymbol {t}}^{\circ 1}\cdot {\boldsymbol {\alpha }},\cdots ,{\boldsymbol {t}}^{\circ n}\cdot {\boldsymbol {\alpha }}),}](https://wikimedia.org/api/rest_v1/media/math/render/svg/c7ebe994197050b4ccc40a211869495f727dcdd9)


![{\textstyle \operatorname {E} \left[({\boldsymbol {t}}_{1}\cdot {\boldsymbol {X}})^{n_{1}}\cdots ({\boldsymbol {t}}_{q}\cdot {\boldsymbol {X}})^{n_{q}}\right]}](https://wikimedia.org/api/rest_v1/media/math/render/svg/ed6c72f24e30368c6adcccfbb3617c8c9cc1bc31)


![{\displaystyle \operatorname {E} \left[\prod _{i=1}^{K}X_{i}^{\beta _{i}}\right]={\frac {B\left({\boldsymbol {\alpha }}+{\boldsymbol {\beta }}\right)}{B\left({\boldsymbol {\alpha }}\right)}}={\frac {\Gamma \left(\sum \limits _{i=1}^{K}\alpha _{i}\right)}{\Gamma \left[\sum \limits _{i=1}^{K}(\alpha _{i}+\beta _{i})\right]}}\times \prod _{i=1}^{K}{\frac {\Gamma (\alpha _{i}+\beta _{i})}{\Gamma (\alpha _{i})}}.}](https://wikimedia.org/api/rest_v1/media/math/render/svg/000cde5700999e94c94e72a072f895799e14a8f9)


![{\displaystyle h({\boldsymbol {X}})=\operatorname {E} [-\ln f({\boldsymbol {X}})]=\ln \operatorname {B} ({\boldsymbol {\alpha }})+(\alpha _{0}-K)\psi (\alpha _{0})-\sum _{j=1}^{K}(\alpha _{j}-1)\psi (\alpha _{j})}](https://wikimedia.org/api/rest_v1/media/math/render/svg/91810eafbfd5cfce470bd92c24a8fca76a38539a)
![{\displaystyle \operatorname {E} [\ln(X_{i})]}](https://wikimedia.org/api/rest_v1/media/math/render/svg/5a72ff2e20477797cea887aa2c6deccc57251e4a)

![{\displaystyle \operatorname {E} [\ln(X_{i})]=\psi (\alpha _{i})-\psi (\alpha _{0})}](https://wikimedia.org/api/rest_v1/media/math/render/svg/ff925b2576c7b676cbea49e091956f72a1b1a17b)
![{\displaystyle \operatorname {Cov} [\ln(X_{i}),\ln(X_{j})]=\psi '(\alpha _{i})\delta _{ij}-\psi '(\alpha _{0})}](https://wikimedia.org/api/rest_v1/media/math/render/svg/6d0cab04d1c306d2c2282187e3cc3d6cf5ede211)


![{\displaystyle S({\boldsymbol {X}})=H({\boldsymbol {Z}}|{\boldsymbol {X}})=\operatorname {E} _{\boldsymbol {Z}}[-\log P({\boldsymbol {Z}}|{\boldsymbol {X}})]=\sum _{i=1}^{K}-X_{i}\log X_{i}}](https://wikimedia.org/api/rest_v1/media/math/render/svg/feb2f04bc8f628ca073a2dd7ab1f72da599c0fe8)

![{\displaystyle \operatorname {E} [S({\boldsymbol {X}})]=\sum _{i=1}^{K}\operatorname {E} [-X_{i}\ln X_{i}]=\psi (K\alpha +1)-\psi (\alpha +1)}](https://wikimedia.org/api/rest_v1/media/math/render/svg/c889788f26f8774d78ab695b97bc597d40649d1d)


![{\displaystyle CF\left(s_{1},\ldots ,s_{K-1}\right)=\operatorname {E} \left(e^{i\left(s_{1}X_{1}+\cdots +s_{K-1}X_{K-1}\right)}\right)=\Psi ^{\left[K-1\right]}(\alpha _{1},\ldots ,\alpha _{K-1};\alpha _{0};is_{1},\ldots ,is_{K-1})}](https://wikimedia.org/api/rest_v1/media/math/render/svg/90de28048866b7aa2c94eb1d206f2fd6c91ec0cf)
![{\displaystyle \Psi ^{[m]}(a_{1},\ldots ,a_{m};c;z_{1},\ldots z_{m})=\sum {\frac {(a_{1})_{k_{1}}\cdots (a_{m})_{k_{m}}\,z_{1}^{k_{1}}\cdots z_{m}^{k_{m}}}{(c)_{k}\,k_{1}!\cdots k_{m}!}}.}](https://wikimedia.org/api/rest_v1/media/math/render/svg/842b921fefdc02d65c732267f532a76b231532a9)


![{\displaystyle \Psi ^{[m]}={\frac {\Gamma (c)}{2\pi i}}\int _{L}e^{t}\,t^{a_{1}+\cdots +a_{m}-c}\,\prod _{j=1}^{m}(t-z_{j})^{-a_{j}}\,dt}](https://wikimedia.org/api/rest_v1/media/math/render/svg/7ea05e80d5aeb9efc0218f02994cb87f35ca7bbc)


![{\displaystyle {\begin{aligned}&{\frac {\left[\prod _{i=1}^{K-1}({\bar {x}}x_{i})^{\alpha _{i}-1}\right]\left[{\bar {x}}(1-\sum _{i=1}^{K-1}x_{i})\right]^{\alpha _{K}-1}}{\prod _{i=1}^{K}\Gamma (\alpha _{i})}}{\bar {x}}^{K-1}e^{-{\bar {x}}}\\=&{\frac {\Gamma ({\bar {\alpha }})\left[\prod _{i=1}^{K-1}(x_{i})^{\alpha _{i}-1}\right]\left[1-\sum _{i=1}^{K-1}x_{i}\right]^{\alpha _{K}-1}}{\prod _{i=1}^{K}\Gamma (\alpha _{i})}}\times {\frac {{\bar {x}}^{{\bar {\alpha }}_{i}-1}e^{-{\bar {x}}}}{\Gamma ({\bar {\alpha }})}}\end{aligned}}}](https://wikimedia.org/api/rest_v1/media/math/render/svg/36ed04c7074f551e316e3ae0f71fcab9fb05fadc)


