
Trempealeau County, Wisconsin
Trempealeau County | |
|---|---|
UTC−5 (CDT) | |
| Congressional district | 3rd |
| Website | www |
Trempealeau County (
History
Patches of woodland are all that remain of the brush and light forest that once covered the county. In ancient times, the woodlands contained a great deal of timber, but
French
During the 19th and 20th century large numbers of
In the late 1850s, Trempealeau became a destination for Polish Prussian settlers from Upper Silesia seeking to escape German persecution and poverty in their homeland. They built churches, schools, and communities to develop what became the nation's second-largest Polish settlement. Their settlements were especially focused around Independence, Arcadia, Whitehall, and Pine Creek. Trempealeau has a large population of Silesian Polish descent to this day.
The county again became an immigrant destination in the first decades of the 21st century, gaining a significant Hispanic and Latino population.[10]
Geography
According to the
Adjacent counties
- Buffalo County - west
- Eau Claire County - north
- Jackson County - east
- La Crosse County - southeast
- Winona County, Minnesota - southwest
Major highways
|
|
Railroads
- BNSF
- Canadian National
Buses
National protected areas
- Trempealeau National Wildlife Refuge (part)
- Upper Mississippi River National Wildlife and Fish Refuge (part)
Demographics
| Census | Pop. | Note | %± |
|---|---|---|---|
| 1860 | 2,560 | — | |
| 1870 | 10,732 | 319.2% | |
| 1880 | 17,189 | 60.2% | |
| 1890 | 18,920 | 10.1% | |
| 1900 | 23,114 | 22.2% | |
| 1910 | 22,928 | −0.8% | |
| 1920 | 24,506 | 6.9% | |
| 1930 | 23,910 | −2.4% | |
| 1940 | 24,381 | 2.0% | |
| 1950 | 23,730 | −2.7% | |
| 1960 | 23,377 | −1.5% | |
| 1970 | 23,344 | −0.1% | |
| 1980 | 26,158 | 12.1% | |
| 1990 | 25,263 | −3.4% | |
| 2000 | 27,010 | 6.9% | |
| 2010 | 28,816 | 6.7% | |
| 2020 | 30,760 | 6.7% | |
| U.S. Decennial Census[12] 1790–1960[13] 1900–1990[14] 1990–2000[15] 2010–2020[16] 2020 census[2] | |||
2020 census
As of the

2000 census
As of the
as their first language.There were 10,747 households, out of which 31.80% had children under the age of 18 living with them, 55.20% were married couples living together, 7.40% had a female householder with no husband present, and 32.60% were non-families. 27.60% of all households were made up of individuals, and 13.50% had someone living alone who was 65 years of age or older. The average household size was 2.45 and the average family size was 3.00.
In the county, the population was spread out, with 25.30% under the age of 18, 6.90% from 18 to 24, 28.20% from 25 to 44, 23.10% from 45 to 64, and 16.40% who were 65 years of age or older. The median age was 38 years. For every 100 females there were 100.30 males. For every 100 females age 18 and over, there were 98.80 males.
In 2017, there were 450 births, giving a general fertility rate of 93.1 births per 1000 women aged 15–44, the third highest rate out of all 72 Wisconsin counties.[20]
Gallery
-
 Fairgrounds in Galesville
 -
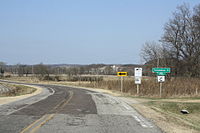 Entrance sign to Trempealeau County in the Town of Ettrick
 -
 The Cow Farm, Trempealeau County


Communities
Cities
- Arcadia
- Blair
- Galesville
- Independence
- Osseo
- Whitehall (county seat)
Villages
- Eleva
- Ettrick
- Pigeon Falls
- Strum
- Trempealeau
Towns
Census-designated place
- Dodge
Unincorporated communities
- Beaches Corners
- Butman Corners
- Chapultepee
- Centerville
- Coral City
- Dewey Corners
- Elk Creek
- Frenchville
- Hale
- Hegg
- Iduna
- North Creek
- Pine Creek
- Pleasantville
- Russell
- Tamarack
- Upper French Creek
- West Prairie
- Wrights Corners
Ghost towns/neighborhoods
- Cortland
- New City
- Williamsburg
Politics
| Year | Republican | Democratic | Third party | |||
|---|---|---|---|---|---|---|
| No. | % | No. | % | No. | % | |
| 2020 | 8,833 | 57.43% | 6,285 | 40.86% | 262 | 1.70% |
| 2016 | 7,366 | 53.82% | 5,636 | 41.18% | 685 | 5.00% |
| 2012 | 5,707 | 42.33% | 7,605 | 56.41% | 169 | 1.25% |
| 2008 | 4,808 | 36.11% | 8,321 | 62.50% | 185 | 1.39% |
| 2004 | 5,878 | 41.80% | 8,075 | 57.42% | 109 | 0.78% |
| 2000 | 5,002 | 41.11% | 6,678 | 54.88% | 488 | 4.01% |
| 1996 | 3,035 | 28.12% | 5,848 | 54.18% | 1,911 | 17.70% |
| 1992 | 3,577 | 27.49% | 6,218 | 47.79% | 3,217 | 24.72% |
| 1988 | 4,902 | 43.87% | 6,212 | 55.59% | 61 | 0.55% |
| 1984 | 6,008 | 52.24% | 5,407 | 47.02% | 85 | 0.74% |
| 1980 | 5,992 | 49.52% | 5,390 | 44.54% | 719 | 5.94% |
| 1976 | 5,341 | 45.56% | 6,218 | 53.05% | 163 | 1.39% |
| 1972 | 5,723 | 56.69% | 4,232 | 41.92% | 140 | 1.39% |
| 1968 | 4,861 | 50.69% | 3,971 | 41.41% | 757 | 7.89% |
| 1964 | 3,264 | 34.04% | 6,320 | 65.91% | 5 | 0.05% |
| 1960 | 5,539 | 51.38% | 5,223 | 48.45% | 19 | 0.18% |
| 1956 | 5,476 | 54.25% | 4,602 | 45.59% | 16 | 0.16% |
| 1952 | 6,501 | 61.63% | 4,021 | 38.12% | 26 | 0.25% |
| 1948 | 3,650 | 43.13% | 4,711 | 55.67% | 102 | 1.21% |
| 1944 | 4,719 | 51.06% | 4,496 | 48.65% | 27 | 0.29% |
| 1940 | 5,319 | 50.28% | 5,175 | 48.92% | 85 | 0.80% |
| 1936 | 3,339 | 33.96% | 5,929 | 60.30% | 564 | 5.74% |
| 1932 | 2,874 | 32.81% | 5,786 | 66.06% | 99 | 1.13% |
| 1928 | 5,596 | 64.97% | 2,963 | 34.40% | 54 | 0.63% |
| 1924 | 2,083 | 31.26% | 373 | 5.60% | 4,208 | 63.15% |
| 1920 | 4,748 | 84.24% | 718 | 12.74% | 170 | 3.02% |
| 1916 | 2,138 | 56.04% | 1,578 | 41.36% | 99 | 2.60% |
| 1912 | 1,763 | 44.66% | 1,235 | 31.28% | 950 | 24.06% |
| 1908 | 3,733 | 75.31% | 1,085 | 21.89% | 139 | 2.80% |
| 1904 | 3,560 | 75.54% | 981 | 20.81% | 172 | 3.65% |
| 1900 | 3,364 | 71.23% | 1,190 | 25.20% | 169 | 3.58% |
| 1896 | 3,306 | 67.66% | 1,394 | 28.53% | 186 | 3.81% |
| 1892 | 2,116 | 53.54% | 1,521 | 38.49% | 315 | 7.97% |
See also
References
- ^ MissPronouncer.com: A HALFWAY DECENT AUDIO PRONUNCIATION GUIDE FOR WISCONSIN
- ^ a b 2020 Population and Housing State Data | Arizona
- ^ "Find a County". National Association of Counties. Retrieved June 7, 2011.
- ^ Gamroth, 1976, p. 5, 87
- Newspapers.com.

- Newspapers.com.
- ^ Elkins, 1985, p.1
- ^ "Wisconsin: Individual County Chronologies". Wisconsin Atlas of Historical County Boundaries. The Newberry Library. 2007. Archived from the original on April 14, 2017. Retrieved August 15, 2015.
- Newspapers.com.
- ^ Emerson, Julian (October 20, 2021). "As Latino Populations Grow, State Also Seeing More Small Businesses". Up North News. Retrieved July 5, 2022.
- ^ "2010 Census Gazetteer Files". United States Census Bureau. August 22, 2012. Retrieved August 9, 2015.
- ^ "U.S. Decennial Census". United States Census Bureau. Retrieved August 9, 2015.
- ^ "Historical Census Browser". University of Virginia Library. Retrieved August 9, 2015.
- ^ Forstall, Richard L., ed. (March 27, 1995). "Population of Counties by Decennial Census: 1900 to 1990". United States Census Bureau. Retrieved August 9, 2015.
- ^ "Census 2000 PHC-T-4. Ranking Tables for Counties: 1990 and 2000" (PDF). United States Census Bureau. April 2, 2001. Archived (PDF) from the original on October 9, 2022. Retrieved August 9, 2015.
- ^ "State & County QuickFacts". United States Census Bureau. Retrieved January 24, 2014.
- ^ "County Population Totals: 2010-2020". Retrieved June 20, 2021.
- ^ "2020 Decennial Census: Trempealeau County, Wisconsin". data.census.gov. U.S. Census Bureau. Retrieved July 5, 2022.
- ^ "U.S. Census website". United States Census Bureau. Retrieved May 14, 2011.
- ^ "Annual Wisconsin Birth and Infant Mortality Report, 2017 P-01161-19 (June 2019): Detailed Tables". Archived from the original on June 19, 2019. Retrieved June 19, 2019.
- ^ Leip, David. "Dave Leip's Atlas of U.S. Presidential Elections". uselectionatlas.org. Retrieved November 9, 2020.
Further reading
- Biographical History of La Crosse, Trempealeau and Buffalo Counties, Wisconsin.. Chicago: Lewis Publishing, 1892.
- Curtiss-Wedge, Franklyn (comp.). History of Trempealeau County, Wisconsin. Chicago: H. C. Cooper Jr. 1917.
- Elkins, Winston (1985). Trempealeau and the Mississippi River Dam. Trempealeau County, Wis.: Trempealeau County Historical Society.
- Gamroth, Clarence J. (Ed.) (1976). Historical Album, 100 Years, Independence, Wisc. Independence, Wis.: City of Independence.
External links
- Trempealeau County
- Trempealeau County map from the Wisconsin Department of Transportation
- Trempealeau County Health and Demographic Data
Places adjacent to Trempealeau County, Wisconsin | ||||||||||||||||
|---|---|---|---|---|---|---|---|---|---|---|---|---|---|---|---|---|
| ||||||||||||||||
 | ||||
Villages |
| |||
Towns | ||||
| CDP | ||||
| Unincorporated communities |
| |||
| ||||
44°18′N 91°21′W / 44.30°N 91.35°W
| International | |
|---|---|
| National | |
| Geographic | |
| Other | |