1929 United Kingdom general election
| |||||||||||||||||||||||||||||||||||||||||||||
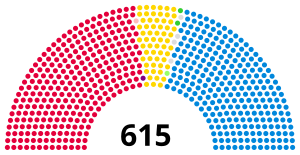
All 615 seats in the House of Commons 308 seats needed for a majority | |||||||||||||||||||||||||||||||||||||||||||||
|---|---|---|---|---|---|---|---|---|---|---|---|---|---|---|---|---|---|---|---|---|---|---|---|---|---|---|---|---|---|---|---|---|---|---|---|---|---|---|---|---|---|---|---|---|---|
| Turnout | 76.3%, | ||||||||||||||||||||||||||||||||||||||||||||
| |||||||||||||||||||||||||||||||||||||||||||||
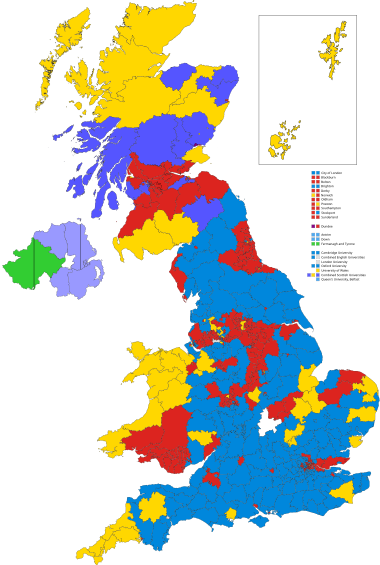 Colours denote the winning party—as shown in § Results | |||||||||||||||||||||||||||||||||||||||||||||
| |||||||||||||||||||||||||||||||||||||||||||||
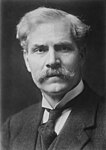
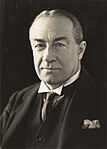
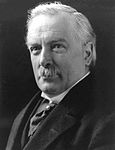
The 1929 United Kingdom general election was held on Thursday, 30 May 1929 and resulted in a hung parliament. Ramsay MacDonald's Labour Party won the most seats in the House of Commons for the first time despite receiving fewer votes than the Conservative Party, led by Prime Minister Stanley Baldwin. The Liberal Party led again by former Prime Minister David Lloyd George regained some ground lost in the 1924 general election and held the balance of power. Parliament was dissolved on 10 May.[1]
The election was often referred to as the "
The election was fought against a background of rising unemployment, with the memory of the 1926 general strike still fresh in voters' minds. By 1929, the Cabinet was being described by many as "old and exhausted".[2]
The Liberals campaigned on a comprehensive programme of public works under the title "We Can Conquer Unemployment". There was anticipation of a potential revival of the Liberal Party after the reunification of Independent Liberals and National Liberals now under Lloyd George's leadership since 1926 and following some victories in a series of recent by-elections after 1926.[3] The incumbent Conservatives campaigned on the theme of "Safety First", with Labour campaigning on the theme of "Labour & the Nation".
This was the first general election to be contested by the newly formed Welsh nationalist party Plaid Cymru.
It stood as the last time when a third party polled more than one-fifth of the popular vote until
Results
| Candidates | Votes | ||||||||||
|---|---|---|---|---|---|---|---|---|---|---|---|
| Party | Leader | Stood | Elected | Gained | Unseated | Net | % of total | % | No. | Net % | |
| Conservative | Stanley Baldwin | 590 | 260 | 2 | 154 | −152 | 42.3 | 38.1 | 8,252,527 | −8.7 | |
| Labour | Ramsay MacDonald | 569 | 287 | 140 | 4 | +136 | 46.7 | 37.1 | 8,048,968 | +3.8 | |
| Liberal | David Lloyd George | 513 | 59 | 36 | 17 | +19 | 9.6 | 23.6 | 5,104,638 | +5.8 | |
Independent
|
N/A | 11 | 4 | 3 | 1 | +2 | 0.8 | 0.4 | 94,742 | +0.2 | |
| Communist | Harry Pollitt | 25 | 0 | 0 | 1 | −1 | 0.2 | 47,554 | −0.1 | ||
Ind. Conservative
|
N/A | 8 | 0 | 0 | 0 | 0 | 0.2 | 46,278 | |||
| Scottish Prohibition | Edwin Scrymgeour | 1 | 1 | 0 | 0 | 0 | 0.2 | 0.1 | 25,037 | +0.1 | |
| Nationalist | Joseph Devlin | 3 | 2 | 2 | 0 | +2 | 0.5 | 0.1 | 24,177 | +0.1 | |
Independent Labour
|
N/A | 4 | 1 | 1 | 0 | +1 | 0.2 | 0.1 | 20,825 | +0.1 | |
| Independent Liberal | N/A | 2 | 0 | 0 | 0 | 0 | 0.1 | 17,110 | +0.1 | ||
| National (Scotland) | Roland Muirhead | 2 | 0 | 0 | 0 | 0 | 0.0 | 3,313 | N/A | ||
| Plaid Cymru | Saunders Lewis | 1 | 0 | 0 | 0 | 0 | 0.0 | 609 | N/A | ||
| Irish Nationalist | T. P. O'Connor | 1 | 1 | 0 | 0 | 0 | 0.0 | 0 | N/A | ||
Votes summary
Seats summary
Constituency results
Transfers of seats
- All comparisons are with the 1924 election.
- In some cases, the change is owing to the MP having defected to the gaining party, and then retaining the seat in 1929. Such circumstances are marked with a *.
- In other circumstances, the change is owing to the seat having been won by the gaining party in a by-election in the intervening years, and then retained in 1929. Such circumstances are marked with a †.
- 1 Previous MP had defected to the Conservatives by the 1929 election
- 2 Previous MP had defected to the Liberals by the 1929 election
See also
- List of MPs elected in the 1929 United Kingdom general election
- 1929 United Kingdom general election in Northern Ireland
- Constituency election results in the 1929 United Kingdom general election
References
- ^ "Parliamentary Election Timetables" (PDF) (3rd ed.). House of Commons Library. 25 March 1997. Retrieved 3 July 2022.
- ^ Doerr 1998, pp. 104–5.
- ^ OCLC 489636152.
- ^ Tetteh, Edmund (1 February 2008). "Election Statistics: UK 1918-2007" (PDF). parliament.uk. Archived from the original (PDF) on 8 July 2014. Retrieved 23 May 2014.
- ^ The seat and vote count figures for the Conservatives given here include the Speaker of the House of Commons
Sources
- ISBN 0900178302
- Doerr, Paul W. (1998), British foreign policy 1919–1939, Manchester: Manchester University Press, ISBN 0719046718
Further reading
- Howell, David (2002), MacDonald's Party: Labour Identities and Crisis, 1922–1939, Oxford
- Redvaldsen, David (2010), "'Today is the Dawn': The Labour Party and the 1929 General Election", Parliamentary History, 29 (3): 395–415,
- S2CID 159673425
External links
- United Kingdom election results—summary results 1885–1979 Archived 30 January 2012 at the Wayback Machine

