
1985 Portuguese local elections
| ||||||||||||||||||||||||||||||||||||||||||||||||||||||||||||||||||||||||||
All 305 Portuguese Parishes All 1,975 local government councils | ||||||||||||||||||||||||||||||||||||||||||||||||||||||||||||||||||||||||||
|---|---|---|---|---|---|---|---|---|---|---|---|---|---|---|---|---|---|---|---|---|---|---|---|---|---|---|---|---|---|---|---|---|---|---|---|---|---|---|---|---|---|---|---|---|---|---|---|---|---|---|---|---|---|---|---|---|---|---|---|---|---|---|---|---|---|---|---|---|---|---|---|---|---|---|
| Turnout | 63.0% | |||||||||||||||||||||||||||||||||||||||||||||||||||||||||||||||||||||||||
| ||||||||||||||||||||||||||||||||||||||||||||||||||||||||||||||||||||||||||

.jpg)
The Portuguese local elections of 1985 took place on 15 December. They were the fourth local elections in Portugal since the democratic revolution of 1974 introduced the concept of democratic local power. The elections took place just nine weeks after the 1985 legislative election and just one month before the 1986 Presidential elections.
The elections consisted of three separate elections in the 305
For the first time, the
The Democratic and Social Center, this time participating alone in every election, after the end of the Democratic Alliance, continued its electoral decline, gathering only 10% of the voting. Despite keeping the same number of mayors achieved in 1982, in the municipalities where it ran alone, 27, the party lost 49 presidencies achieved in coalition with the Social Democrats.
The Portuguese Communist Party and the Portuguese Democratic Movement, united in the United People Alliance, lost 1% of the voting in comparison with the election of 1982 and lost 8 mayors, gathering only 47 presidencies. However, despite losing only 1% of the voting in the elections to Municipal Assemblies, the coalition lost almost 700 assembly members, decreasing its representation to 1062 members due to the overall reduction of mandates.
The newly founded Democratic Renewal Party, achieved almost 5% of the voting and the presidency of 3 municipalities. In the elections to Municipal Assemblies it gathered almost 6% of the voting and 270 Assembly members, being the great surprise of the election.
Turnout in these elections fell more than eight points compared with 1982, with 63% of voters casting a ballot. It was also the last local election under a 3-year term.
Parties
The main political forces involved in the election were:
- United People Alliance (APU)
- Democratic and Social Center(CDS)
- Democratic Renewal Party (PRD)
- Socialist Party (PS)
- Social Democratic Party (PSD)
Results
Municipal Councils
National summary of votes and seats
| Parties | Votes | % | Candidacies | Councillors | Mayors | ||||
|---|---|---|---|---|---|---|---|---|---|
| Total | ± | Total | ± | ||||||
| Social Democratic | 1,633,247 | 34.19 | 819 | 149 | |||||
| Socialist | 1,318,287 | 27.60 | 574 | 79 | |||||
| United People Alliance | 935,897 | 19.59 | 303 | 47 | |||||
Democratic and Social Centre
|
466,965 | 9.78 | 222 | 27 | |||||
| Democratic Renewal | 224,161 | 4.69 | 49 | — | 3 | — | |||
People's Democratic Union
|
28,701 | 0.60 | 3 | 0 | |||||
| People's Monarchist | 23,968 | 0.50 | 3 | 0 | |||||
Portuguese Workers' Communist
|
10,967 | 0.23 | 0 | 0 | |||||
| Christian Democratic | 7,910 | 0.17 | 2 | 0 | |||||
Workers Party of Socialist Unity
|
2,324 | 0.05 | 0 | 0 | |||||
| Total valid | 4,631,497 | 96.97 | — | 1,975 | 305 | ||||
| Blank ballots | 73,784 | 1.54 | |||||||
| Invalid ballots | 71,126 | 1.49 | |||||||
| Total | 4,776,407 | 100.00 | |||||||
| Registered voters/turnout | 7,578,622 | 63.02 | |||||||
Municipality map
.png)
Municipalities won by:
■ - PSD: 149
■ - PS: 79
■ - APU: 47
■ - CDS: 27
■ - PRD: 3
City control
The following table lists party control in all district capitals, as well as in municipalities above 100,000 inhabitants. Population estimates from the 1981 Census.[3]
Municipal Assemblies
National summary of votes and seats
| Parties | Votes | % | Candidacies | Mandates | |||||
|---|---|---|---|---|---|---|---|---|---|
| Total | ± | ||||||||
| Social Democratic | 1,391,500 | 29.59 | 2,509 | ||||||
| Socialist | 1,142,381 | 24.30 | 1,796 | ||||||
| United People Alliance | 953,935 | 20.29 | 1,056 | ||||||
Democratic and Social Centre
|
761,855 | 16.20 | 1,015 | ||||||
| Democratic Renewal | 245,830 | 5.22 | 273 | — | |||||
People's Democratic Union
|
31,899 | 0.68 | 14 | ||||||
| People's Monarchist | 15,949 | 0.34 | 7 | ||||||
Portuguese Workers' Communist
|
6,396 | 0.14 | 0 | ||||||
| Christian Democratic | 4,002 | 0.09 | 2 | ||||||
| Socialist League of the Workers | 783 | 0.02 | 0 | — | |||||
Workers Party of Socialist Unity
|
254 | 0.00 | 0 | ||||||
| Total valid | 4,543,206 | 96.62 | — | 6,672 | |||||
| Blank ballots | 88,935 | 1.89 | |||||||
| Invalid ballots | 69,854 | 1.48 | |||||||
| Total | 4,701,995 | 100.00 | |||||||
| Registered voters/turnout | 7,444,150 | 63.16 | |||||||
Parish Assemblies
National summary of votes and seats
| Parties | Votes | % | Candidacies | Mandates | Presidents | ||||
|---|---|---|---|---|---|---|---|---|---|
| Total | ± | Total | ± | ||||||
| Social Democratic | 1,584,427 | 32.85 | 13,118 | ||||||
| Socialist | 1,303,425 | 27.02 | 9,039 | ||||||
| United People Alliance | 993,767 | 20.60 | 3,676 | ||||||
Democratic and Social Centre
|
507,499 | 10.52 | 4,531 | ||||||
| Democratic Renewal | 164,345 | 3.41 | 726 | — | — | ||||
| Independents | 67,601 | 1.40 | 797 | ||||||
People's Democratic Union
|
28,572 | 0.59 | 26 | ||||||
Portuguese Workers' Communist
|
4,153 | 0.09 | 0 | ||||||
| People's Monarchist | 2,585 | 0.05 | 24 | ||||||
| Christian Democratic | 1,021 | 0.02 | 4 | ||||||
Workers Party of Socialist Unity
|
792 | 0.02 | 0 | ||||||
| Total valid | 4,658,187 | 96.67 | — | 31,941 | — | — | |||
| Blank ballots | 84,797 | 1.77 | |||||||
| Invalid ballots | 80,766 | 1.67 | |||||||
| Total | 4,823,750 | 100.00 | |||||||
| Registered voters/turnout | 7,652,786 | 63.52 | |||||||
Maps
-
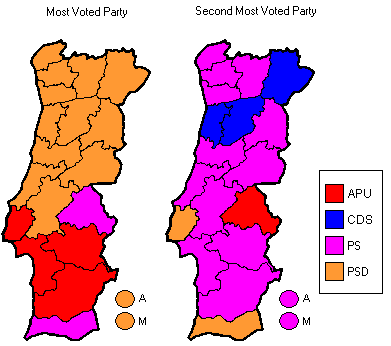 The first and the second most voted parties in Municipal Councils in each district.
 -
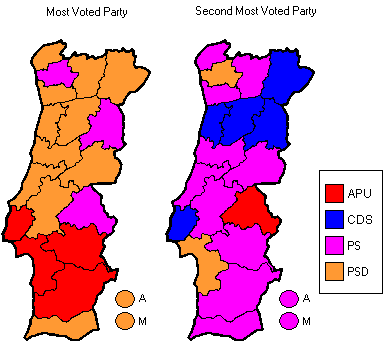 The first and the second most voted parties in Municipal Assemblies in each district.
 -
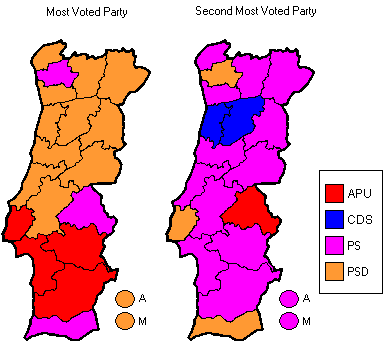 The first and the second most voted parties in Parish Assemblies in each district.


Notes
- The source of the voting data is the Portuguese Electoral Commission Archived 2020-02-05 at the Wayback Machine
Further Notes:
- United People Alliance (APU) was composed by the Portuguese Communist Party (PCP) and the Portuguese Democratic Movement (MDP/CDE).
- The number of candidacies expresses the number of municipalities or parishes in which the party or coalition presented lists.
- The number of mandates expresses the number of municipal deputies in the Municipal Assembly election and the number of parish deputies in the Parish Assembly election.
- The turnout varies because one may choose not to vote for all the organs.
See also
References
- ^ Cities where the PSD contested alone. Not with coalitions with CDS or PPM.
- ^ Cities where the CDS contested alone. Not with coalitions with PSD or PPM.
- ^ "Instituto Nacional de Estatística (Recenseamentos Gerais da População)". www.ine.pt (in Portuguese). Statistics Portugal. Retrieved 17 July 2021.
External links
| Presidential elections | |
|---|---|
| Parliamentary elections |
|
| Constituent Assembly elections | |
| Local elections | |
| European elections | |
| Referendums | |
| |