
2022 London local elections
| |||||||||||||||||||||||||||||||||||||||||||||||||||||||||||||||||
All 1,817 councillors on all 32 London boroughs, and 5 directly-elected mayors | |||||||||||||||||||||||||||||||||||||||||||||||||||||||||||||||||
|---|---|---|---|---|---|---|---|---|---|---|---|---|---|---|---|---|---|---|---|---|---|---|---|---|---|---|---|---|---|---|---|---|---|---|---|---|---|---|---|---|---|---|---|---|---|---|---|---|---|---|---|---|---|---|---|---|---|---|---|---|---|---|---|---|---|
| |||||||||||||||||||||||||||||||||||||||||||||||||||||||||||||||||
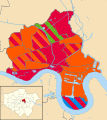
 Map showing London borough councils by political control following the elections, as shown in the main table of results. Black denotes no overall control. | |||||||||||||||||||||||||||||||||||||||||||||||||||||||||||||||||

.jpg)
.jpg)
_(cropped).jpg)
The 2022 London local elections took place on 5 May 2022, as part of the 2022 United Kingdom local elections. All London borough councillor seats were up for election. Mayoral elections took place in Hackney, Lewisham, Newham and Tower Hamlets, with Croydon electing a mayor for the first time following a local referendum in October 2021.
The election saw Labour gain majority control of
Background
The previous borough council elections in
Twenty-five of the thirty-two boroughs will be electing councillors under new ward boundaries following reviews by the Local Government Boundary Commission for England.[11]
Campaign
In January 2022, the Conservative peer
A poll by Survation on what issues would affect how people voted showed Council Tax, the Westminster lockdown parties controversy, and social care quality as the main issues, with far fewer voters ranking Low Traffic Neighbourhood schemes as one of the issues that would most affect how they vote.[16]
The Liberal Democrats launched their local election campaign on 6 April. The party were targeting seats on Merton Council.[17] Labour launched their London local election campaign on 9 April, with the national party leader Keir Starmer and the mayor of London saying that the Conservative government had "abandoned" London and were not concerned about the rising cost of living.[18]
The journalist Ben Walker, writing in the New Statesman, modelled what the election results would look like according to the voteshares in an April poll by Opinium. His model showed Labour gaining control of Wandsworth and Barnet, with 1,157 to 1,188 seats across the city, while the Conservatives would win between 428 and 452 seats, the Liberal Democrats would win between 149 and 179 seats, and the Green Party would win between 11 and 22 seats.[19]
Council results
Summary
| Party[20] | Votes won | % votes | Change | Seats | % seats | Change | Councils | Change | |
|---|---|---|---|---|---|---|---|---|---|
| Labour | 984,585 | 42.5 | 1,156 | 63.6 | 21 | ||||
| Conservative | 598,734 | 25.8 | 404 | 22.2 | 5 | ||||
| Liberal Democrats | 333,635 | 14.4 | 180 | 9.9 | 3 | ||||
| Green | 270,750 | 11.7 | 18 | 1.0 | 0 | ||||
| Others | 131,194 | 5.6 | 59 | 3.2 | 1 | ||||
| No overall control | — | 2 | |||||||
Control
Councillors
The table below shows the number of councillors won by each party for each council in London. The shaded cells show the party or parties in each council's governing administration.
Mayors
| Council | Mayor before | Elected mayor | ||
|---|---|---|---|---|
| Croydon | New office | Jason Perry (Con) | ||
| Hackney | Philip Glanville (Lab) | Philip Glanville (Lab) | ||
| Lewisham | Damien Egan (Lab) | Damien Egan (Lab) | ||
| Newham | Rokhsana Fiaz (Lab) | Rokhsana Fiaz (Lab) | ||
| Tower Hamlets | John Biggs (Lab) | Lutfur Rahman (Aspire) | ||
Opinion polling
| Date(s) conducted |
Polling organisation/client | Sample size |
Lab | Con | Lib Dem | Green | Others | Don't know | Wouldn't vote | Refused | Lead |
|---|---|---|---|---|---|---|---|---|---|---|---|
| 5 May 2022 | 2022 elections[21] | n/a | 42.5% | 25.8% | 14.4% | 11.7% | 5.6% | - | - | - | 16.7% |
| 19–22 April 2022 | YouGov/QMUL | 1,232 | 50% | 23% | 12% | 9% | - | - | - | - | 27% |
| 14–20 April 2022 | Opinium/Sky News | 1,000 | 45% | 25% | 12% | 10% | - | - | - | - | 20% |
| 3–7 March 2022 | Deltapoll/London Communications Agency | 1,026 | 54% | 24% | 9% | 5% | 8% | - | - | - | 30% |
| 28 February – 3 March 2022 | YouGov/QMUL | 1,114 | 34% | 17% | 8% | 6% | 3% | 9% | 17% | 5% | 17% |
| 3 May 2018 | 2018 elections | n/a | 43.9% | 28.8% | 13.0% | 8.6% | 5.7% | - | - | - | 15.0% |
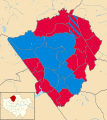
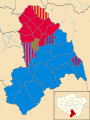
Ward result maps
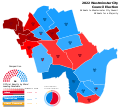
London-wide
The map below shows the results for each ward across the whole of Greater London.

By borough
-
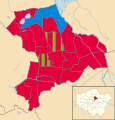
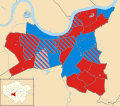
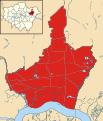 Barking and Dagenham 2022 results map
 -
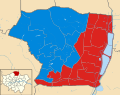
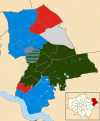
 Barnet 2022 results map
 -
 Bexley 2022 results map
 -
 Brent 2022 results map
 -
 Bromley 2022 results map
 -
 Camden 2022 results map
 -
 Croydon 2022 results map
 -
 Ealing 2022 results map
 -
 Enfield 2022 results map
 -
 Greenwich 2022 results map
 -
 Hackney 2022 results map
 -
 Hammersmith and Fulham 2022 results map
 -
 Haringey 2022 results map
 -
 Harrow 2022 results map
 -
 Havering 2022 results map
 -
 Hillingdon 2022 results map
 -
 Islington 2022 results map
 -
 Kensington and Chelsea 2022 results map
 -
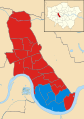
 Tower Hamlets 2022 results map
 -
 Wandsworth 2022 results map
 -
 Westminster 2022 results map


See also
Notes
References
- ^ "Local Elections Handbook 2022" (PDF). Elections Centre. Nuffield Politics Research Centre University. Retrieved 22 March 2023.
- ^ Grafton-Green, Patrick; Chaplain, Chloe (5 May 2018). "The full list of results for London's local elections". www.standard.co.uk. Retrieved 21 December 2020.
- ^ Stewart, Heather; Walker, Peter (5 May 2018). "Local elections: neither Corbyn nor May able to break poll deadlock". The Guardian. Retrieved 21 December 2020.
- ^ James, William (4 May 2018). "May avoids London wipeout in local elections". Reuters. Retrieved 21 December 2020.
- ^ Hill, Dave (25 September 2020). "Newham: Mayor confirms wish for governance referendum in May as rivals' petition ruled invalid". OnLondon. Retrieved 20 December 2020.
- London Evening Standard. Retrieved 20 December 2020.
- ^ a b Chappell, Elliot (15 April 2021). "Local governance referendums taking place this year: what, why and where?". LabourList. Retrieved 19 April 2021.
- ^ Smulian, Mark (10 May 2021). "Referendums back mayoral systems despite mayors' misgivings". Local Government Chronicle (LGC). Retrieved 13 September 2021.
- ^ Hill, Dave (21 September 2020). "Croydon: Referendum on changing to mayoral system cannot take place next May, council leader says". OnLondon. Retrieved 20 December 2020.
- ^ "Croydon referendum: Residents vote for directly elected mayor". BBC News. 8 October 2021. Retrieved 10 October 2021.
- ^ "LGBCE | London Boroughs | LGBCE Site". www.lgbce.org.uk. Retrieved 19 October 2021.
- ^ Bond, David (4 January 2022). "Boris faces worst London results for 50 years, says Tory poll guru". www.standard.co.uk. Retrieved 17 January 2022.
- ^ Hill, Dave (14 March 2022). "New poll gives Labour huge lead in London as borough elections near". OnLondon. Retrieved 23 March 2022.
- ^ Bowes, Nick (30 March 2022). "Nick Bowes: Keys tests for the London borough elections". OnLondon. Retrieved 30 March 2022.
- ^ Rallings, Colin; Thrasher, Michael (6 April 2022). "Labour could struggle to make gains - Rallings & Thrasher's pre-election analysis". Local Government Chronicle (LGC). Retrieved 10 April 2022.
- ^ Talora, Joe (8 April 2022). "Council tax ranked as top local election priority in London". Evening Standard. Retrieved 10 April 2022.
- ^ Harris, Simon (6 April 2022). "Lib Dem leader eyes up London target seats as local election campaign kicks off". ITV News. Retrieved 10 April 2022.
- ^ "Local elections: London abandoned by government, Labour says". BBC News. 8 April 2022. Retrieved 10 April 2022.
- ^ "How will London vote in the 2022 local elections?". State of the Nation. 26 April 2022. Retrieved 27 April 2022.
- ^ @BritainElects (22 May 2018). "Ward-by-ward results for the 2018..." (Tweet) – via Twitter.
- ^ "2022 London local election results (Britain Elects aggregate)". Google Docs. Retrieved 12 April 2023.