
Current–voltage characteristic
This article needs additional citations for verification. (August 2008) |
A current–voltage characteristic or I–V curve (current–voltage curve) is a relationship, typically represented as a chart or graph, between the electric current through a circuit, device, or material, and the corresponding voltage, or potential difference, across it.
In electronics


In
In electronic components with more than two terminals, such as vacuum tubes and transistors, the current–voltage relationship at one pair of terminals may depend on the current or voltage on a third terminal. This is usually displayed on a more complex current–voltage graph with multiple curves, each one representing the current–voltage relationship at a different value of current or voltage on the third terminal.[1]
For example the diagram at right shows a family of I–V curves for a MOSFET as a function of drain voltage with overvoltage (VGS − Vth) as a parameter.
The simplest I–V curve is that of a
The I–V curve of an electrical component can be measured with an instrument called a
Types of I–V curves
The shape of an electrical component's characteristic curve reveals much about its operating properties. I–V curves of different devices can be grouped into categories:

- Active vs passive: Devices which have I–V curves which are limited to the first and third Conventional current always flows through these devices in the direction of the electric field, from the positive voltage terminal to the negative, so the charges lose potential energyin the device, which is converted to heat or some other form of energy.
- In contrast, devices with I–V curves which pass through the second or fourth quadrants are batteries and generators. When it is operating in the second or fourth quadrant, current is forced to flow through the device from the negative to the positive voltage terminal, against the opposing force of the electric field, so the electric charges are gaining potential energy. Thus the device is converting some other form of energy into electric energy.
- resistance, equal to the reciprocalof the slope of the line, is constant. A curved I–V line represents a nonlinear resistance, such as a diode. In this type the resistance varies with the applied voltage or current.
- differential resistance, while regions of positive slope represent positive differential resistance. Negative resistance devices can be used to make amplifiers and oscillators. Tunnel diodes and Gunn diodesare examples of components that have negative resistance.
- Hysteresis vs single-valued: Devices which have neon lights.
-
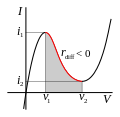 I–V curve similar to a tunnel diode characteristic curve. It has negative resistance in the shaded voltage region, between v1 and v2
 -
 DIAC I–V curve. VBO is the breakover voltage.
 -
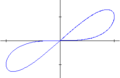 Memristor I–V curve, showing a pinched hysteresis
 -
 Gunn diode I–V curve, showing negative differential resistance with hysteresis (notice arrows)


In electrophysiology

While I–V curves are applicable to any electrical system, they find wide use in the field of biological electricity, particularly in the sub-field of electrophysiology. In this case, the voltage refers to the voltage across a biological membrane, a membrane potential, and the current is the flow of charged ions through channels in this membrane. The current is determined by the conductances of these channels.
In the case of ionic current across biological membranes, currents are measured from inside to outside. That is, positive currents, known as "outward current", corresponding to positively charged ions crossing a cell membrane from the inside to the outside, or a negatively charged ion crossing from the outside to the inside. Similarly, currents with a negative value are referred to as "inward current", corresponding to positively charged ions crossing a cell membrane from the outside to the inside, or a negatively charged ion crossing from inside to outside.
The figure to the right shows an I–V curve that is more relevant to the currents in excitable biological membranes (such as a neuronal axon). The blue line shows the I–V relationship for the potassium ion. It is linear, indicating no voltage-dependent gating of the potassium ion channel. The yellow line shows the I–V relationship for the sodium ion. It is not linear, indicating that the sodium ion channel is voltage-dependent. The green line indicates the I–V relationship derived from summing the sodium and potassium currents. This approximates the actual membrane potential and current relationship of a cell containing both types of channel.