
Demographics of Luton
| Demographics of Luton | |
|---|---|
 Population pyramid of Luton | |
| Population | 225,261 (2021) |
| Density | 4,696/km2 (12,160/sq mi) (2011) |

Since the 2011 census, Luton has had a white British population less than 50%, one of three towns in the United Kingdom along with Leicester and Slough. Luton has a majority white population, when non-British white people such as the Irish and Eastern Europeans are included.[2] Identity wise, 81% of the population of Luton define themselves as British of any race.[3]

Ethnicity


The following table shows the ethnic group of respondents for estimations for 1971 and in the 1991 to 2021 censuses in Luton.
Luton is a majority minority town in which no single ethnic group make up the majority of residents, however by broad multi-ethnic groups,
| Ethnic Group | 1971 estimations[4] | 1981 estimations[5] | 1991[6] | 2001[7] | 2011[8] | 2021[9] | ||||||
|---|---|---|---|---|---|---|---|---|---|---|---|---|
| Number | % | Number | % | Number | % | Number | % | Number | % | Number | % | |
| White: Total | 148,061 | 93.3% | 139,705 | 86.1% | 137,665 | 80.19% | 132,566 | 71.90% | 111,079 | 54.66% | 101,798 | 45.2% |
| White: British | – | – | – | – | – | – | 119,793 | 64.97% | 90,530 | 44.55% | 71,532 | 31.8% |
| White: Irish | – | – | – | – | 9,266 | 5.4% | 8,569 | 4.65% | 6,126 | 3.01% | 4,570 | 2.0% |
| White: Gypsy or Irish Traveller[note 1]
|
– | – | – | – | – | – | – | – | 198 | 0.10% | 238 | 0.1% |
| White: Roma | – | – | – | – | – | – | – | – | – | – | 808 | 0.4% |
| White: Other | – | – | – | – | – | – | 4,204 | 2.28% | 14,225 | 7.00% | 24,650 | 10.9% |
Asian or Asian British : Total
|
– | – | – | – | 24,114 | 14.04% | 34,773 | 18.86% | 60,952 | 30% | 83,325 | 37.1% |
| Asian or Asian British: Indian | – | – | – | – | 7,205 | 7,538 | 4.09% | 10,625 | 5.23% | 12,096 | 5.4% | |
| Asian or Asian British: Pakistani | – | – | – | – | 10,657 | 17,012 | 9.23% | 29,353 | 14.45% | 41,143 | 18.3% | |
| Asian or Asian British: Bangladeshi | – | – | – | – | 4,679 | 7,641 | 4.14% | 13,606 | 6.70% | 20,630 | 9.2% | |
| Asian or Asian British: Chinese[note 2] | – | – | – | – | 655 | 1,096 | 0.59% | 1,497 | 0.74% | 901 | 0.4% | |
| Asian or Asian British: Other Asian | – | – | – | – | 918 | 1,486 | 0.81% | 5,871 | 2.89% | 8,555 | 3.8% | |
| Black or Black British: Total | – | – | – | – | 8,307 | 4.83% | 11,684 | 6.34% | 19,909 | 9.80% | 22,735 | 10% |
| Black or Black British: African | – | – | – | – | 608 | 3,204 | 1.74% | 9,169 | 4.51% | 11,774 | 5.2% | |
| Black or Black British: Caribbean | – | – | – | – | 6,238 | 7,653 | 4.15% | 8,177 | 4.02% | 8,216 | 3.6% | |
| Black or Black British: Other Black | – | – | – | – | 1,461 | 827 | 0.45% | 2,563 | 1.26% | 2,745 | 1.2% | |
| Mixed: Total | – | – | – | – | – | – | 4,728 | 2.56% | 8,281 | 4.08% | 9,620 | 4.3% |
| Mixed: White and Black Caribbean | – | – | – | – | – | – | 2,414 | 1.31% | 3,831 | 1.89% | 3,486 | 1.5% |
| Mixed: White and Black African | – | – | – | – | – | – | 389 | 0.21% | 915 | 0.45% | 1,268 | 0.6% |
| Mixed: White and Asian | – | – | – | – | – | – | 1,058 | 0.57% | 1,805 | 0.89% | 2,429 | 1.1% |
| Mixed: Other Mixed | – | – | – | – | – | – | 867 | 0.47% | 1,730 | 0.85% | 2,437 | 1.1% |
| Other: Total | – | – | – | – | 1,585 | 0.92% | 620 | 0.34% | 2,980 | 1.47% | 7,783 | 3.4% |
| Other: Arab[note 3] | – | – | – | – | – | – | – | – | 1,646 | 0.81% | 2,106 | 0.9% |
| Other: Any other ethnic group | – | – | – | – | 1,585 | 0.92% | 620 | 0.34% | 1,334 | 0.66% | 5,677 | 2.5% |
| Ethnic minority: Total | 10,694 | 6.7% | 22,626 | 13.9% | 34,006 | 19.8% | 51,805 | 28.1% | 92,122 | 45.3% | 123,463 | 54.8% |
| Total | 158,755 | 100% | 162,331 | 100% | 171,671 | 100% | 184,371 | 100% | 203,201 | 100% | 225,261 | 100% |
Notes
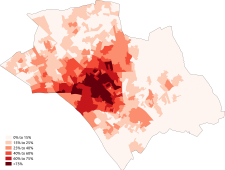
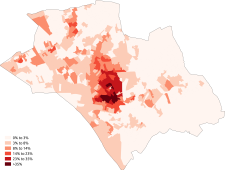
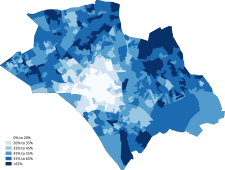
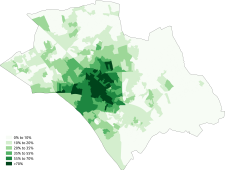
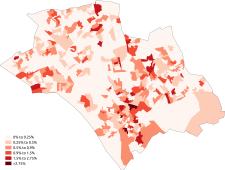
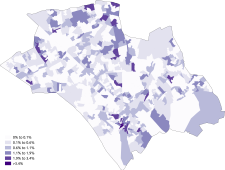
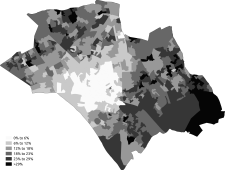
Distribution
-
 White
White -
 White-British
 -
 White-Irish
 -
 White-Other
 -
 Asian
Asian -
 Asian-Indian
 -
 Asian-Pakistani
 -
 Asian-Bangladeshi
 -
 Asian-Chinese
 -
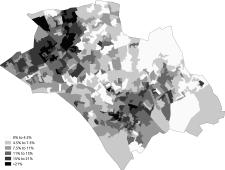 Black
Black -
 Black-African
 -
 Black-Caribbean
 -
 Other-Arab


Ethnicity of school pupils
Luton's schools are
| Ethnic group | School year[10][11] | |||||
|---|---|---|---|---|---|---|
| 2004 | 2015/16 | 2021/2022 | ||||
| Number | % | Number | % | Number | % | |
| White: Total | 14,900 | 53.5% | 7,285 | 29.4% | 12,230 | 30.2% |
| White: British | 13,780 | 49.5% | 4,229 | 17.1% | 6,972 | 17.2% |
| White: Irish | 550 | 112 | 154 | |||
| White: Traveller of Irish heritage | 40 | 34 | 44 | |||
| White: Gypsy/Roma | 20 | 151 | 169 | |||
| White: Other | 510 | 2,759 | 4,891 | |||
Asian / Asian British : Total
|
8,140 | 29.3% | 12,089 | 48.8% | 19,185 | 47.4% |
| Asian / Asian British: Indian | 950 | 3.4% | 888 | 3.6% | 1,571 | 3.9% |
| Asian / Asian British: Pakistani | 4,090 | 14.7% | 6,177 | 24.9% | 10,163 | 25.1% |
| Asian / Asian British: Bangladeshi | 2,080 | 149 | 4,998 | |||
| Asian / Asian British: Chinese | 90 | 46 | 87 | |||
| Asian / Asian British: Other Asians | 930 | 1,235 | 2,366 | |||
| Black / Black British: Total | 2,510 | 9% | 2,140 | 8.6% | 3,995 | 9.9% |
| Black: Caribbean | 1,320 | 327 | 1,013 | |||
| Black: African | 950 | 1,653 | 2,613 | |||
| Black: Other Blacks | 250 | 160 | 369 | |||
| Mixed / British Mixed | 1,750 | 6.3% | 2,105 | 8.5% | 3,676 | 9.1% |
| Other: Total | 170 | 0.6% | 909 | 3.7% | 890 | 2.2% |
| Unclassified | 390 | 266 | 475 | |||
| Total: | 27,840 | 100% | 24,794 | 100% | 40,451 | 100% |
Country of birth

Languages
The most common main languages spoken in Luton according to the 2011 census are shown in the following table.[12]
| Rank | Language | Usual residents aged 3+ | Proportion |
|---|---|---|---|
| 1 | English | 153,463 | 79.43% |
| 2 | Urdu |
8,567 | 4.43% |
| 3 | Polish | 8,006 | 4.14% |
| 4 | Bengali | 6,337 | 3.28% |
| 5 | Punjabi | 2,203 | 1.14% |
| 6 | Gujarati | 1,714 | 0.89% |
| 7 | Arabic |
1,037 | 0.54% |
| 8 | Lithuanian | 698 | 0.36% |
| 9 | Tamil | 653 | 0.34% |
| 10 | Tagalog/Filipino | 524 | 0.27% |
| 11 | Shona | 489 | 0.25% |
| 12 | Hindi |
484 | 0.25% |
| 13 | French | 439 | 0.23% |
| 14 | Portuguese | 397 | 0.21% |
| 15 | Slovak | 352 | 0.18% |
| 16 | Italian | 342 | 0.18% |
| 17 | Romanian | 340 | 0.18% |
| 18 | Russian | 324 | 0.17% |
| 19 | Malayalam |
316 | 0.16% |
| 20 | Pashto |
293 | 0.15% |
| Other | 6,217 | 3.22% |
Religion

The following table shows the religion of respondents in the 2001, 2011 and 2021 censuses in Luton.
| Religion | 2001[13] | 2011[14] | 2021[15] | |||
|---|---|---|---|---|---|---|
| Number | % | Number | % | Number | % | |
| Christian | 109,973 | 59.65% | 96,271 | 47.38% | 85,297 | 37.87% |
| Buddhist | 456 | 0.25% | 652 | 0.32% | 664 | 0.3% |
| Hindu | 5,025 | 2.73% | 6,749 | 3.32% | 7,438 | 3.30% |
| Jewish | 534 | 0.29% | 326 | 0.16% | 246 | 0.1% |
| Muslim | 26,963 | 14.62% | 49,991 | 24.60% | 74,191 | 32.94% |
| Sikh | 1,487 | 0.81% | 2,347 | 1.16% | 3,032 | 1.35% |
| Other religion | 642 | 0.35% | 898 | 0.44% | 1,115 | 0.5% |
| No religion | 25,960 | 14.08% | 33,594 | 16.53% | 39,580 | 17.57% |
| Religion not stated | 13,331 | 7.23% | 12,373 | 6.09% | 13,697 | 6.08% |
| Total | 184,371 | 100.00% | 203,201 | 100.00% | 225,262 | 100.0 |
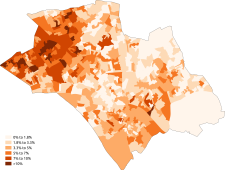
Distribution
-
 Christianity
 -
 Islam
Islam -
 Judaism
 -
 Hinduism
 -
 Sikhism
 -
 Buddhism
 -
 Other religion
 -
 No religion


See also
- Demographics of the United Kingdom
- Demographics of England
- Demographics of London
- Demographics of Birmingham
- Demographics of Greater Manchester
- List of English cities by population
- List of English districts by population
- List of English districts and their ethnic composition
- List of English districts by area
- List of English districts by population density
References
- ^ "LUTON BOROUGH PROFILE 2011 CENSUS DATA" (PDF).
- ^ a b "Local Authority by Ethnic Group". Office for National Statistics. Retrieved 20 February 2013.
- ^ Philipson, Alice (10 January 2013). "White Britons a minority in Leicester, Luton and Slough". Telegraph. Retrieved 17 March 2013.
- JSTOR 622127.
- ^ Equality, Commission for Racial (1985). "Ethnic minorities in Britain: statistical information on the pattern of settlement". Commission for Racial Equality: Table 2.2.
- ^ Data is taken from United Kingdom Casweb Data services of the United Kingdom 1991 Census on Ethnic Data for England, Scotland and Wales (Table 6)
- ^ "Office of National Statistics; 2001 Census Key Statistics". webarchive.nationalarchives.gov.uk. Retrieved 7 September 2021.
- ^ "2011 Census: Ethnic Group, local authorities in England and Wales". webarchive.nationalarchives.gov.uk. Retrieved 15 December 2021.
- ^ "Ethnic group - Office for National Statistics". www.ons.gov.uk. Retrieved 29 November 2022.
- ^ "School and pupil characteristics". webarchive.nationalarchives.gov.uk. Retrieved 8 November 2022.
- ^ "Schools, pupils and their characteristics, Academic Year 2021/22". explore-education-statistics.service.gov.uk. Retrieved 9 September 2022.
- ^ "Download:local authorities: county / unitary". NOMIS. Retrieved 17 June 2015.
- ^ "2001 census - theme tables". Retrieved 17 June 2015.
- ^ "Download:local authorities: county / unitary". NOMIS. Retrieved 17 June 2015.
- ^ "Religion - Religion by local authorities, ONS".