
List of municipalities in Montana

In Montana, municipalities are divided into four classes by state statute based on their population.[4] Members of the three largest classes are deemed cities, while the members of the fourth class are called towns. Cities and towns are classified at the time of their organization, and are reorganized when they change classification due to an increase or decrease in population. A place may incorporate as a town with the support of 300 electors or two-thirds of the registered electors.[5] A municipality with a population between 1,000 and 5,000 people is a Third Class city. A municipality with a population between 5,000 and 10,000 people is a Second Class city. And a municipality with a population over 10,000 people is a First Class city. Under certain exceptions municipalities with a population of between 9,000 and 10,000 may elect by resolution to be either a First or Second Class city. Under similar exceptions municipalities with a population of between 5,000 and 7,500 may elect by resolution to be either a Second or Third Class city. Municipalities with a population of between 1,000 and 2,500 may by resolution be classified as either a town or Third Class city.[6] Unincorporated places such as census-designated places fall outside this scheme, and are subject to county governance, and thus are neither cities nor towns.
The largest municipality by population in Montana is Billings with 117,116 residents, and the smallest municipality by population is Ismay with 17 residents.[7] The largest municipality by land area is Anaconda, a consolidated city-county, which spans 736.53 sq mi (1,907.6 km2), while Rexford and Flaxville are the smallest at 0.10 sq mi (0.26 km2).[2]
List of cities and towns
- Largest cities and towns in Montana by population
-
 Downtown Billings, Montana's largest municipality by population
 -
 Missoula, Montana's second largest municipality by population
 -
 Great Falls, third largest municipality by population in Montana
 -
 Downtown Bozeman, Montana's fourth largest municipality by population
 -
 Uptown Butte, fifth largest municipality by population in Montana
 -

-
 Kalispell, looking toward Glacier National Park
 -
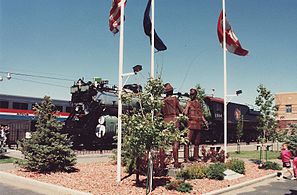 Havre railroad station and the sculpture "U.S. − Canada Friendship"
 -
 Downtown Anaconda, the largest city in Montana by land area
 -
 Downtown Miles City, Montana's eleventh largest municipality by population


‡ State capital and county seat
| Name | Type[2] | County[2] | Population (2020)[7] |
Population (2010)[2] |
Change | Land area (2010)[2] |
Population density | |
|---|---|---|---|---|---|---|---|---|
| sq mi | km2 | |||||||
| Alberton | Town | Mineral | 452 | 420 | +7.6% | 0.57 | 1.5 | 793.0/sq mi (306.2/km2) |
| Anaconda† | Consolidated city-county | Deer Lodge | 9,421 | 9,298 | +1.3% | 736.53 | 1,907.6 | 12.8/sq mi (4.9/km2) |
| Bainville | Town | Roosevelt | 271 | 208 | +30.3% | 1.02 | 2.6 | 265.7/sq mi (102.6/km2) |
| Baker† | City | Fallon | 1,802 | 1,741 | +3.5% | 0.97 | 2.5 | 1,857.7/sq mi (717.3/km2) |
| Bearcreek | Town | Carbon | 91 | 79 | +15.2% | 0.12 | 0.31 | 758.3/sq mi (292.8/km2) |
| Belgrade | City | Gallatin | 10,460 | 7,389 | +41.6% | 3.25 | 8.4 | 3,218.5/sq mi (1,242.7/km2) |
| Belt | Town | Cascade | 510 | 597 | −14.6% | 0.35 | 0.91 | 1,457.1/sq mi (562.6/km2) |
| Big Sandy | Town | Chouteau | 605 | 598 | +1.2% | 0.44 | 1.1 | 1,375.0/sq mi (530.9/km2) |
| Big Timber† | City | Sweet Grass | 1,650 | 1,641 | +0.5% | 0.92 | 2.4 | 1,793.5/sq mi (692.5/km2) |
| Billings† | City | Yellowstone | 117,116 | 104,170 | +12.4% | 43.41 | 112.4 | 2,697.9/sq mi (1,041.7/km2) |
| Boulder† | Town | Jefferson | 1,201 | 1,183 | +1.5% | 1.13 | 2.9 | 1,062.8/sq mi (410.4/km2) |
| Bozeman† | City | Gallatin | 53,293 | 37,280 | +43.0% | 19.12 | 49.5 | 2,787.3/sq mi (1,076.2/km2) |
| Bridger | Town | Carbon | 662 | 708 | −6.5% | 0.80 | 2.1 | 827.5/sq mi (319.5/km2) |
| Broadus† | Town | Powder River | 456 | 468 | −2.6% | 0.34 | 0.88 | 1,341.2/sq mi (517.8/km2) |
| Broadview | Town | Yellowstone | 139 | 192 | −27.6% | 0.26 | 0.67 | 534.6/sq mi (206.4/km2) |
| Browning | Town | Glacier | 1,018 | 1,016 | +0.2% | 0.27 | 0.70 | 3,770.4/sq mi (1,455.7/km2) |
| Butte† | Consolidated city-county | Silver Bow | 34,494 | 33,525 | +2.9% | 716.25 | 1,855.1 | 48.2/sq mi (18.6/km2) |
| Cascade | Town | Cascade | 600 | 685 | −12.4% | 0.52 | 1.3 | 1,153.8/sq mi (445.5/km2) |
| Chester† | Town | Liberty | 847 | 847 | 0.0% | 0.48 | 1.2 | 1,764.6/sq mi (681.3/km2) |
| Chinook† | City | Blaine | 1,185 | 1,203 | −1.5% | 0.51 | 1.3 | 2,323.5/sq mi (897.1/km2) |
| Choteau† | City | Teton | 1,721 | 1,684 | +2.2% | 1.83 | 4.7 | 940.4/sq mi (363.1/km2) |
| Circle† | Town | McCone | 591 | 615 | −3.9% | 0.78 | 2.0 | 757.7/sq mi (292.5/km2) |
| Clyde Park | Town | Park | 332 | 288 | +15.3% | 0.32 | 0.83 | 1,037.5/sq mi (400.6/km2) |
| Colstrip | City | Rosebud | 2,096 | 2,214 | −5.3% | 4.47 | 11.6 | 468.9/sq mi (181.0/km2) |
| Columbia Falls | City | Flathead | 5,308 | 4,688 | +13.2% | 2.05 | 5.3 | 2,589.3/sq mi (999.7/km2) |
| Columbus† | Town | Stillwater | 1,857 | 1,893 | −1.9% | 1.32 | 3.4 | 1,406.8/sq mi (543.2/km2) |
| Conrad† | City | Pondera | 2,318 | 2,570 | −9.8% | 1.25 | 3.2 | 1,854.4/sq mi (716.0/km2) |
| Culbertson | Town | Roosevelt | 753 | 714 | +5.5% | 0.60 | 1.6 | 1,255.0/sq mi (484.6/km2) |
| Cut Bank† | City | Glacier | 3,056 | 2,869 | +6.5% | 0.99 | 2.6 | 3,086.9/sq mi (1,191.8/km2) |
| Darby | Town | Ravalli | 783 | 720 | +8.7% | 0.58 | 1.5 | 1,350.0/sq mi (521.2/km2) |
| Deer Lodge† | City | Powell | 2,938 | 3,111 | −5.6% | 1.44 | 3.7 | 2,040.3/sq mi (787.8/km2) |
| Denton | Town | Fergus | 205 | 255 | −19.6% | 0.76 | 2.0 | 269.7/sq mi (104.1/km2) |
| Dillon† | City | Beaverhead | 3,880 | 4,134 | −6.1% | 1.76 | 4.6 | 2,204.5/sq mi (851.2/km2) |
| Dodson | Town | Phillips | 125 | 124 | +0.8% | 0.19 | 0.49 | 657.9/sq mi (254.0/km2) |
| Drummond | Town | Granite | 272 | 309 | −12.0% | 0.53 | 1.4 | 513.2/sq mi (198.2/km2) |
| Dutton | Town | Teton | 303 | 316 | −4.1% | 0.31 | 0.80 | 977.4/sq mi (377.4/km2) |
| East Helena | City | Lewis and Clark | 1,944 | 1,984 | −2.0% | 1.73 | 4.5 | 1,123.7/sq mi (433.9/km2) |
| Ekalaka† | Town | Carter | 399 | 332 | +20.2% | 1.04 | 2.7 | 383.7/sq mi (148.1/km2) |
| Ennis | Town | Madison | 917 | 838 | +9.4% | 0.77 | 2.0 | 1,190.9/sq mi (459.8/km2) |
| Eureka | Town | Lincoln | 1,380 | 1,037 | +33.1% | 1.01 | 2.6 | 1,366.3/sq mi (527.5/km2) |
| Fairfield | Town | Teton | 759 | 708 | +7.2% | 0.31 | 0.80 | 2,448.4/sq mi (945.3/km2) |
| Fairview | Town | Richland | 896 | 840 | +6.7% | 0.97 | 2.5 | 923.7/sq mi (356.6/km2) |
| Flaxville | Town | Daniels | 63 | 71 | −11.3% | 0.10 | 0.26 | 630.0/sq mi (243.2/km2) |
| Forsyth† | City | Rosebud | 1,647 | 1,777 | −7.3% | 0.99 | 2.6 | 1,663.6/sq mi (642.3/km2) |
| Fort Benton† | City | Chouteau | 1,449 | 1,464 | −1.0% | 2.07 | 5.4 | 700.0/sq mi (270.3/km2) |
| Fort Peck | Town | Valley | 239 | 233 | +2.6% | 0.86 | 2.2 | 277.9/sq mi (107.3/km2) |
| Froid | Town | Roosevelt | 195 | 185 | +5.4% | 0.28 | 0.73 | 696.4/sq mi (268.9/km2) |
| Fromberg | Town | Carbon | 392 | 438 | −10.5% | 0.48 | 1.2 | 816.7/sq mi (315.3/km2) |
| Geraldine | Town | Chouteau | 207 | 261 | −20.7% | 0.52 | 1.3 | 398.1/sq mi (153.7/km2) |
| Glasgow† | City | Valley | 3,202 | 3,250 | −1.5% | 1.43 | 3.7 | 2,239.2/sq mi (864.5/km2) |
| Glendive† | City | Dawson | 4,873 | 4,935 | −1.3% | 3.32 | 8.6 | 1,467.8/sq mi (566.7/km2) |
| Grass Range | Town | Fergus | 110 | 110 | 0.0% | 0.15 | 0.39 | 733.3/sq mi (283.1/km2) |
| Great Falls† | City | Cascade | 60,442 | 58,505 | +3.3% | 21.79 | 56.4 | 2,773.8/sq mi (1,071.0/km2) |
| Hamilton† | City | Ravalli | 4,659 | 4,348 | +7.2% | 2.53 | 6.6 | 1,841.5/sq mi (711.0/km2) |
| Hardin† | City | Big Horn | 3,818 | 3,505 | +8.9% | 2.57 | 6.7 | 1,485.6/sq mi (573.6/km2) |
| Harlem | City | Blaine | 769 | 808 | −4.8% | 0.43 | 1.1 | 1,788.4/sq mi (690.5/km2) |
| Harlowton† | City | Wheatland | 955 | 997 | −4.2% | 0.58 | 1.5 | 1,646.6/sq mi (635.7/km2) |
| Havre† | City | Hill | 9,362 | 9,310 | +0.6% | 3.28 | 8.5 | 2,854.3/sq mi (1,102.0/km2) |
| Helena‡ | City | Lewis and Clark | 32,091 | 28,190 | +13.8% | 16.35 | 42.3 | 1,962.8/sq mi (757.8/km2) |
| Hingham | Town | Hill | 131 | 118 | +11.0% | 0.17 | 0.44 | 770.6/sq mi (297.5/km2) |
| Hobson | City | Judith Basin | 179 | 215 | −16.7% | 0.24 | 0.62 | 745.8/sq mi (288.0/km2) |
| Hot Springs | Town | Sanders | 557 | 544 | +2.4% | 0.38 | 0.98 | 1,465.8/sq mi (565.9/km2) |
| Hysham† | Town | Treasure | 276 | 312 | −11.5% | 0.21 | 0.54 | 1,314.3/sq mi (507.4/km2) |
| Ismay | Town | Custer | 17 | 19 | −10.5% | 0.42 | 1.1 | 40.5/sq mi (15.6/km2) |
| Joliet | Town | Carbon | 577 | 595 | −3.0% | 0.30 | 0.78 | 1,923.3/sq mi (742.6/km2) |
| Jordan† | Town | Garfield | 356 | 343 | +3.8% | 0.34 | 0.88 | 1,047.1/sq mi (404.3/km2) |
| Judith Gap | City | Wheatland | 110 | 126 | −12.7% | 0.38 | 0.98 | 289.5/sq mi (111.8/km2) |
| Kalispell† | City | Flathead | 24,558 | 19,927 | +23.2% | 11.64 | 30.1 | 1,711.9/sq mi (661.0/km2) |
| Kevin | Town | Toole | 154 | 154 | 0.0% | 0.34 | 0.88 | 452.9/sq mi (174.9/km2) |
| Laurel | City | Yellowstone | 7,222 | 6,718 | +7.5% | 2.14 | 5.5 | 3,374.8/sq mi (1,303.0/km2) |
| Lavina | Town | Golden Valley | 136 | 187 | −27.3% | 1.00 | 2.6 | 136.0/sq mi (52.5/km2) |
| Lewistown† | City | Fergus | 5,952 | 5,901 | +0.9% | 5.32 | 13.8 | 1,118.8/sq mi (432.0/km2) |
| Libby† | City | Lincoln | 2,775 | 2,628 | +5.6% | 1.91 | 4.9 | 1,452.9/sq mi (561.0/km2) |
| Lima | Town | Beaverhead | 212 | 221 | −4.1% | 0.53 | 1.4 | 400.0/sq mi (154.4/km2) |
| Livingston† | City | Park | 8,040 | 7,044 | +14.1% | 6.02 | 15.6 | 1,335.5/sq mi (515.7/km2) |
| Lodge Grass | Town | Big Horn | 441 | 428 | +3.0% | 0.24 | 0.62 | 1,837.5/sq mi (709.5/km2) |
| Malta† | City | Phillips | 1,860 | 1,997 | −6.9% | 1.06 | 2.7 | 1,754.7/sq mi (677.5/km2) |
| Manhattan | Town | Gallatin | 2,086 | 1,520 | +37.2% | 1.93 | 5.0 | 1,080.8/sq mi (417.3/km2) |
| Medicine Lake | Town | Sheridan | 244 | 225 | +8.4% | 0.40 | 1.0 | 610.0/sq mi (235.5/km2) |
| Melstone | Town | Musselshell | 126 | 96 | +31.3% | 0.69 | 1.8 | 182.6/sq mi (70.5/km2) |
| Miles City† | City | Custer | 8,354 | 8,410 | −0.7% | 3.34 | 8.7 | 2,501.2/sq mi (965.7/km2) |
| Missoula† | City | Missoula | 73,489 | 66,788 | +10.0% | 27.51 | 71.3 | 2,671.4/sq mi (1,031.4/km2) |
| Moore | Town | Fergus | 194 | 193 | +0.5% | 0.24 | 0.62 | 808.3/sq mi (312.1/km2) |
| Nashua | Town | Valley | 301 | 290 | +3.8% | 0.66 | 1.7 | 456.1/sq mi (176.1/km2) |
| Neihart | Town | Cascade | 43 | 51 | −15.7% | 1.99 | 5.2 | 21.6/sq mi (8.3/km2) |
| Opheim | Town | Valley | 75 | 85 | −11.8% | 0.21 | 0.54 | 357.1/sq mi (137.9/km2) |
| Outlook | Town | Sheridan | 84 | 47 | +78.7% | 1.30 | 3.4 | 64.6/sq mi (24.9/km2) |
| Philipsburg† | Town | Granite | 841 | 820 | +2.6% | 0.80 | 2.1 | 1,051.3/sq mi (405.9/km2) |
| Pinesdale | Town | Ravalli | 805 | 917 | −12.2% | 1.29 | 3.3 | 624.0/sq mi (240.9/km2) |
| Plains | Town | Sanders | 1,106 | 1,048 | +5.5% | 0.59 | 1.5 | 1,874.6/sq mi (723.8/km2) |
| Plentywood† | City | Sheridan | 1,669 | 1,734 | −3.7% | 1.17 | 3.0 | 1,426.5/sq mi (550.8/km2) |
| Plevna | Town | Fallon | 179 | 162 | +10.5% | 0.59 | 1.5 | 303.4/sq mi (117.1/km2) |
| Polson† | City | Lake | 5,148 | 4,488 | +14.7% | 4.14 | 10.7 | 1,243.5/sq mi (480.1/km2) |
| Poplar | City | Roosevelt | 758 | 810 | −6.4% | 0.28 | 0.73 | 2,707.1/sq mi (1,045.2/km2) |
| Red Lodge† | City | Carbon | 2,257 | 2,125 | +6.2% | 2.80 | 7.3 | 806.1/sq mi (311.2/km2) |
| Rexford | Town | Lincoln | 78 | 105 | −25.7% | 0.10 | 0.26 | 780.0/sq mi (301.2/km2) |
| Richey | Town | Dawson | 164 | 177 | −7.3% | 0.24 | 0.62 | 683.3/sq mi (263.8/km2) |
| Ronan | City | Lake | 1,955 | 1,871 | +4.5% | 1.19 | 3.1 | 1,642.9/sq mi (634.3/km2) |
| Roundup† | City | Musselshell | 1,742 | 1,788 | −2.6% | 1.34 | 3.5 | 1,300.0/sq mi (501.9/km2) |
| Ryegate† | Town | Golden Valley | 223 | 245 | −9.0% | 0.69 | 1.8 | 323.2/sq mi (124.8/km2) |
| Saco | Town | Phillips | 159 | 197 | −19.3% | 0.33 | 0.85 | 481.8/sq mi (186.0/km2) |
| Scobey† | City | Daniels | 999 | 1,017 | −1.8% | 0.76 | 2.0 | 1,314.5/sq mi (507.5/km2) |
| Shelby† | City | Toole | 3,169 | 3,376 | −6.1% | 6.03 | 15.6 | 525.5/sq mi (202.9/km2) |
| Sheridan | Town | Madison | 694 | 642 | +8.1% | 1.02 | 2.6 | 680.4/sq mi (262.7/km2) |
| Sidney† | City | Richland | 6,346 | 5,191 | +22.3% | 2.66 | 6.9 | 2,385.7/sq mi (921.1/km2) |
| St. Ignatius | Town | Lake | 768 | 842 | −8.8% | 0.56 | 1.5 | 1,371.4/sq mi (529.5/km2) |
| Stanford† | Town | Judith Basin | 403 | 401 | +0.5% | 0.44 | 1.1 | 915.9/sq mi (353.6/km2) |
| Stevensville | Town | Ravalli | 2,002 | 1,809 | +10.7% | 0.98 | 2.5 | 2,042.9/sq mi (788.8/km2) |
| Sunburst | Town | Toole | 333 | 375 | −11.2% | 0.24 | 0.62 | 1,387.5/sq mi (535.7/km2) |
| Superior† | Town | Mineral | 830 | 812 | +2.2% | 1.04 | 2.7 | 798.1/sq mi (308.1/km2) |
| Terry† | Town | Prairie | 562 | 605 | −7.1% | 0.71 | 1.8 | 791.5/sq mi (305.6/km2) |
| Thompson Falls† | City | Sanders | 1,336 | 1,313 | +1.8% | 1.73 | 4.5 | 772.3/sq mi (298.2/km2) |
| Three Forks | City | Gallatin | 1,989 | 1,869 | +6.4% | 1.44 | 3.7 | 1,381.3/sq mi (533.3/km2) |
| Townsend† | City | Broadwater | 1,787 | 1,878 | −4.8% | 1.58 | 4.1 | 1,131.0/sq mi (436.7/km2) |
| Troy | City | Lincoln | 797 | 938 | −15.0% | 0.76 | 2.0 | 1,048.7/sq mi (404.9/km2) |
| Twin Bridges | Town | Madison | 330 | 375 | −12.0% | 0.96 | 2.5 | 343.8/sq mi (132.7/km2) |
| Valier | Town | Pondera | 530 | 509 | +4.1% | 0.92 | 2.4 | 576.1/sq mi (222.4/km2) |
| Virginia City† | Town | Madison | 219 | 190 | +15.3% | 0.95 | 2.5 | 230.5/sq mi (89.0/km2) |
| Walkerville | Town | Silver Bow | 639 | 675 | −5.3% | 2.23 | 5.8 | 286.5/sq mi (110.6/km2) |
| West Yellowstone | Town | Gallatin | 1,272 | 1,271 | +0.1% | 0.80 | 2.1 | 1,590.0/sq mi (613.9/km2) |
| Westby | Town | Sheridan | 167 | 168 | −0.6% | 0.54 | 1.4 | 309.3/sq mi (119.4/km2) |
| White Sulphur Springs† | City | Meagher | 955 | 939 | +1.7% | 1.01 | 2.6 | 945.5/sq mi (365.1/km2) |
| Whitefish | City | Flathead | 7,751 | 6,357 | +21.9% | 6.43 | 16.7 | 1,205.4/sq mi (465.4/km2) |
| Whitehall | Town | Jefferson | 1,006 | 1,038 | −3.1% | 0.67 | 1.7 | 1,501.5/sq mi (579.7/km2) |
| Wibaux† | Town | Wibaux | 462 | 589 | −21.6% | 1.08 | 2.8 | 427.8/sq mi (165.2/km2) |
| Winifred | Town | Fergus | 172 | 208 | −17.3% | 0.50 | 1.3 | 344.0/sq mi (132.8/km2) |
| Winnett† | Town | Petroleum | 188 | 182 | +3.3% | 0.98 | 2.5 | 191.8/sq mi (74.1/km2) |
| Wolf Point† | City | Roosevelt | 2,517 | 2,621 | −4.0% | 0.87 | 2.3 | 2,893.1/sq mi (1,117.0/km2) |
| Total towns | 76 | — | 38,130 | 37,333 | +2.1% | 49.01 | 126.9 | 778.0/sq mi (300.4/km2) |
| Total cities | 53 | — | 549,663 | 494,659 | +11.1% | 1,685.57 | 4,365.6 | 326.1/sq mi (125.9/km2) |
| Total | 129 | — | 587,793 | 531,992 | +10.5% | 1,734.58 | 4,492.5 | 338.9/sq mi (130.8/km2) |
See also
References
- ^ a b "2020 Population and Housing State Data". United States Census Bureau. Retrieved November 2, 2021.
- ^ 2010 United States Census. United States Census Bureau. Archived from the originalon February 13, 2020. Retrieved August 8, 2016.
- ^ Montana Legislature. "Classification of municipalities, Montana Code Annotated, (M.C.A.) 7-1-4124". Legislative Services Division. Retrieved July 30, 2016.
- ^ Montana Legislature. "Classification of municipalities, Montana Code Annotated, (M.C.A.) 7-1-4111". Legislative Services Division. Retrieved July 30, 2016.
- ^ Montana Legislature. "Classification of municipalities, Montana Code Annotated, (M.C.A.) 7-2-4101". Legislative Services Division. Retrieved July 30, 2016.
- ^ Montana Legislature. "Exceptions from classification system, M.C.A. 7-1-4112". Legislative Services Division. Retrieved July 30, 2016.
- ^ a b "U.S. Census website". United States Census Bureau. Retrieved November 2, 2021.
Helena (capital) | |
| Topics | |
| Society | |
| Regions |
|
Largest cities | |
| Counties |
|