
Crinitz
Crinitz | |
|---|---|
 | |
Location of Crinitz within Elbe-Elster district  | |
Ortsteile | |
| Government | |
| • Mayor (2019–24) | Uwe Mader[1] (Left) |
| Area | |
| • Total | 21.83 km2 (8.43 sq mi) |
| Elevation | 99 m (325 ft) |
| Population (2022-12-31)[2] | |
| • Total | 1,149 |
| • Density | 53/km2 (140/sq mi) |
| Time zone | UTC+01:00 (CET) |
| • Summer (DST) | UTC+02:00 (CEST) |
| Postal codes | 03246 |
| Dialling codes | 035324 |
| Vehicle registration | EE, FI, LIB |
| Website | www.crinitz.de |
Crinitz (
Lower Sorbian: Krynica) is a municipality in the Elbe-Elster district, in Lower Lusatia, Brandenburg, Germany
.
History
From 1815 to 1947, Crinitz was part of the Prussian Province of Brandenburg. From 1952 to 1990, it was part of the Bezirk Cottbus of East Germany. The municipality in its current borders was created on 26 October 2003 by the legally decreed incorporation of the municipality of Gahro into the municipality of Crinitz.[3] Both municipalities had been administered by the Kleine Elster (Niederlausitz) office (until 1995 Amt Kleine Elster) since 1992.
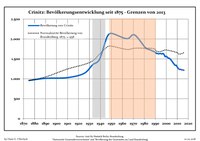
Demography
|
|
|
References
- ^ Landkreis Elbe-Elster Wahl der Bürgermeisterin / des Bürgermeisters, accessed 1 July 2021.
- Amt für Statistik Berlin-Brandenburg(in German). June 2023.
- ^ www.bravors.brandenburg.de http://www.bravors.brandenburg.de/sixcms/detail.php?gsid=land_bb_bravors_01.c.14010.de. Retrieved 2023-05-18.
{{cite web}}: Missing or empty|title=(help) - ^ Detailed data sources are to be found in the Wikimedia Commons.Population Projection Brandenburg at Wikimedia Commons
External links
![]() Media related to Crinitz at Wikimedia Commons
Media related to Crinitz at Wikimedia Commons
Towns and municipalities in Elbe-Elster | ||
|---|---|---|
|  | |
| International | |
|---|---|
| National | |
This Brandenburg location article is a stub. You can help Wikipedia by expanding it. |