
Sonnewalde
Sonnewalde | |
|---|---|
 Coat of arms | |
Location of Sonnewalde within Elbe-Elster district  | |
Ortsteile bzw. Stadtbezirke | |
| Government | |
| • Mayor (2019–27) | Felix Freitag[1] |
| Area | |
| • Total | 118.54 km2 (45.77 sq mi) |
| Elevation | 101 m (331 ft) |
| Population (2022-12-31)[2] | |
| • Total | 3,169 |
| • Density | 27/km2 (69/sq mi) |
| Time zone | UTC+01:00 (CET) |
| • Summer (DST) | UTC+02:00 (CEST) |
| Postal codes | 03249 |
| Dialling codes | 035323 |
| Vehicle registration | EE, FI, LIB |
| Website | www.stadt-sonnewalde.de |
Sonnewalde is a town in the Elbe-Elster district, in Lower Lusatia, Brandenburg, Germany. It is situated 8 km northwest of Finsterwalde.

History
From 1815 to 1947, Sonnewalde was part of the Prussian Province of Brandenburg. From 1952 to 1990, it was part of the Bezirk Cottbus of East Germany.
Demography
-
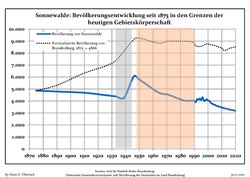 Development of Population since 1875 within the Current Boundaries (Blue Line: Population; Dotted Line: Comparison to Population Development of Brandenburg state; Grey Background: Time of Nazi rule; Red Background: Time of Communist rule)
 -
 Recent Population Development and Projections (Population Development before Census 2011 (blue line); Recent Population Development according to the Census in Germany in 2011 (blue bordered line); Official projections for 2005-2030 (yellow line); for 2017-2030 (scarlet line); for 2020-2030 (green line)


|
|
|
References
- ^ Landkreis Elbe-Elster Wahl der Bürgermeisterin / des Bürgermeisters, accessed 1 July 2021.
- Amt für Statistik Berlin-Brandenburg(in German). June 2023.
- ^ Detailed data sources are to be found in the Wikimedia Commons.Population Projection Brandenburg at Wikimedia Commons
Towns and municipalities in Elbe-Elster | ||
|---|---|---|
|  | |
| International | |
|---|---|
| National | |
This Brandenburg location article is a stub. You can help Wikipedia by expanding it. |