
Schlieben
Schlieben | |
|---|---|
 General view of Schlieben with the bell tower of historic St Martins Church | |
 Coat of arms | |
Location of Schlieben within Elbe-Elster district  | |
Ortsteile | |
| Government | |
| • Mayor (2019–24) | Cornelia Schülzchen[1] (CDU) |
| Area | |
| • Total | 78.22 km2 (30.20 sq mi) |
| Elevation | 89 m (292 ft) |
| Population (2022-12-31)[2] | |
| • Total | 2,397 |
| • Density | 31/km2 (79/sq mi) |
| Time zone | UTC+01:00 (CET) |
| • Summer (DST) | UTC+02:00 (CEST) |
| Postal codes | 04936 |
| Dialling codes | 035361 |
| Vehicle registration | EE, FI, LIB |
| Website | www.schlieben.com |
Schlieben (
Holocaust.[3]
History
From 1815 to 1944, Schlieben was part of the Prussian Province of Saxony. From 1944 to 1945, it was part of the Province of Halle-Merseburg. From 1952 to 1990, it was part of the Bezirk Cottbus of East Germany.
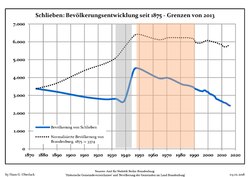
Demography
|
|
Personalities
Sons and daughters of the city
- Ernst Legal (1881-1955), actor, director and director
Personalities connected with the city
- Edwin Zimmermann (* 1948), politician (SPD), 1990-1997 Minister for Food, Agriculture and Forestry of the State of Brandenburg
References
- ^ Landkreis Elbe-Elster Wahl der Bürgermeisterin / des Bürgermeisters, accessed 1 July 2021.
- Amt für Statistik Berlin-Brandenburg(in German). June 2023.
- ^ "Collections Search - United States Holocaust Memorial Museum Search Results".
- ^ Detailed data sources are to be found in the Wikimedia Commons.Population Projection Brandenburg at Wikimedia Commons
Towns and municipalities in Elbe-Elster | ||
|---|---|---|
|  | |
| International | |
|---|---|
| National | |
This Brandenburg location article is a stub. You can help Wikipedia by expanding it. |