
Demographics of Sheffield
| Demographics of Sheffield | |
|---|---|
 Population pyramid of Sheffield | |
| Population | 584,853 (2019) |

The latest (2022) population estimate for the City of Sheffield is 566,242 residents.[1] This represents an increase of about 17,000 people since the last census in 2011.
In the 21st century the city has undergone a population growth above that of the national average, and is projected to increase to over 600,000 by 2020.[2] This can largely be attributed to immigration and relatively high birth rates.[3]
Population
People from Sheffield (or 'Sheffielders') are colloquially known to residents of the surrounding towns of Barnsley, Doncaster, Rotherham and Chesterfield as "dee-dars", which derives from the traditional pronunciation of the "th" in the dialectal words "thee" and "thou", still used, especially by older people, in South Yorkshire.

As with many British cities, the major period of growth in Sheffield's population occurred during the
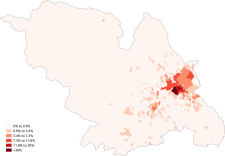
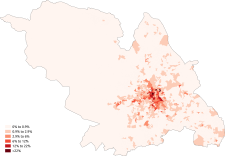
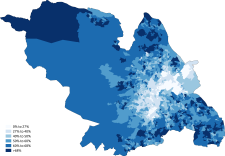
Ethnicity


The following table shows the ethnic group of respondents in the 2001 and 2011 censuses in Sheffield.
| Ethnic Group | 1971 estimations[8] | 1981 estimations[9] | 1991[10] | 2001[11] | 2011[12] | 2021[13] | ||||||
|---|---|---|---|---|---|---|---|---|---|---|---|---|
| Number | % | Number | % | Number | % | Number | % | Number | % | Number | % | |
| White: Total | 509,449 | 98% | 508,795 | 96.8% | 475,977 | 94.96% | 468,217 | 91.23% | 462,544 | 83.69% | 440,216 | 79.1% |
| White: British | – | – | – | – | – | – | 457,728 | 89.19% | 446,837 | 80.85% | 414,698 | 74.5% |
| White: Irish | – | – | – | – | 3,437 | – | 3,337 | 0.65% | 2,891 | 0.52% | 2,750 | 0.5% |
| White: Gypsy or Irish Traveller[note 1]
|
– | – | – | – | – | – | – | – | 358 | 0.06% | 341 | 0.1% |
| White: Roma | – | – | – | – | – | – | – | – | – | – | 2,456 | 0.4% |
| White: Other | – | – | – | – | – | – | 7,152 | 1.39% | 12,458 | 2.25% | 19,971 | 3.6% |
Asian or Asian British : Total
|
– | – | – | – | 13,655 | 2.72% | 25,583 | 4.98% | 44,385 | 8.03% | 53,560 | 9.6% |
| Asian or Asian British: Indian | – | – | – | – | 1,415 | – | 3,030 | 0.59% | 5,868 | 1.06% | 6,798 | 1.2% |
| Asian or Asian British: Pakistani | – | – | – | – | 8,880 | 1.77% | 15,844 | 3.09% | 21,990 | 3.98% | 27,671 | 5.0% |
| Asian or Asian British: Bangladeshi | – | – | – | – | 1,082 | – | 1,910 | 0.37% | 3,326 | 0.60% | 4,258 | 0.8% |
| Asian or Asian British: Chinese[note 2] | – | – | – | – | 1,330 | – | 2,201 | 0.43% | 7,398 | 1.34% | 7,393 | 1.3% |
| Asian or Asian British: Other Asian | – | – | – | – | 948 | – | 2,598 | 0.51% | 5,803 | 1.05% | 7,440 | 1.3% |
| Black or Black British: Total | – | – | – | – | 7,972 | 1.59% | 9,142 | 1.78% | 20,082 | 3.63% | 25,512 | 4.6% |
| Black or Black British: African | – | – | – | – | 1,092 | – | 3,294 | 0.64% | 11,543 | 2.09% | 18,237 | 3.3% |
| Black or Black British: Caribbean | – | – | – | – | 5,007 | 0.99% | 5,171 | 1.01% | 5,506 | 1.00% | 4,647 | 0.8% |
| Black or Black British: Other Black | – | – | – | – | 1,873 | – | 677 | 0.13% | 3,033 | 0.55% | 2,628 | 0.5% |
| Mixed: Total | – | – | – | – | – | – | 8,228 | 1.60% | 13,289 | 2.40% | 19,704 | 3.5% |
| Mixed: White and Black Caribbean | – | – | – | – | – | – | 3,704 | 0.72% | 5,450 | 0.99% | 7,524 | 1.4% |
| Mixed: White and Black African | – | – | – | – | – | – | 711 | 0.14% | 1,296 | 0.23% | 2,431 | 0.4% |
| Mixed: White and Asian | – | – | – | – | – | – | 2,085 | 0.41% | 3,490 | 0.63% | 5,214 | 0.9% |
| Mixed: Other Mixed | – | – | – | – | – | – | 1,728 | 0.34% | 3,053 | 0.55% | 4,535 | 0.8% |
| Other: Total | – | – | – | – | 3,598 | - | 2,064 | 0.40% | 12,398 | 2.24% | 17,531 | 3.1% |
| Other: Arab[note 3] | – | – | – | – | – | – | – | – | 8,432 | 1.53% | 8,956 | 1.6% |
| Other: Any other ethnic group | – | – | – | – | 3,598 | – | 2,064 | 0.40% | 3,966 | 0.72% | 8,575 | 1.5% |
| Non-White: Total | 10,551 | 2% | 16,839 | 3.2% | 25,225 | 5% | 45,017 | 8.8% | 90,154 | 16.3% | 116,307 | 20.9% |
| Total | 520,000 | 100% | 525,634 | 100% | 501,202 | 100% | 513,234 | 100% | 552,698 | 100% | 556,523 | 100% |
Notes for table above
By far the largest
South Asians
The
Somalis and Ethiopians
The Sheffield Somali community is the second largest and one of the oldest in the
Black Caribbeans
The
Black Africans
Black Africans are one of the newest and fastest growing ethnic groups in the city, with the majority being immigrants from war-torn or politically unstable countries. Most Black Africans tend to use Afro-Caribbean stores and community centres instead of starting up their own centres and stores. The majority of Black Africans live in
. The number of Black Africans living in Sheffield in 2006 was 8,300.East Europeans
There has been a large East European Community in Sheffield since the 1940s, when many Polish citizens settled in the city instead of returning to their homeland. A Polish Consulate was opened in Sheffield in 1997 in honour of this. The Sheffield East European community has grown substantially since 2004 when several East European countries joined the E.U with the main settlers being from Poland, Latvia and Slovakia. In July 2006 the Home Office gave Sheffield City Council extra funds to look after and house its large new immigrant East European communities. An interesting fact is that the Polish community in Sheffield despite the fact of its small size has own independent internet newspaper Sheffield24.pl which is active non-stop from 2011.
Chinese
The
Spanish
Sheffield has one of the largest Spanish-descended populations in the country, with over 3,000
Other Groups
Other ethnic groups of Sheffield include
Sheffield is one of the UK's major cities that is part of the
-
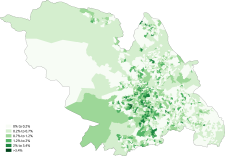
 White
White -
 White-British
 -
 White-Irish
 -
 White-Other
 -
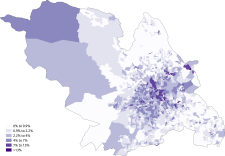
 Asian
Asian -
 Asian-Indian
 -
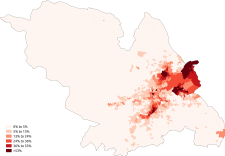
 Asian-Pakistani
 -
 Asian-Bangladeshi
 -
 Asian-Chinese
 -
 Black
Black -
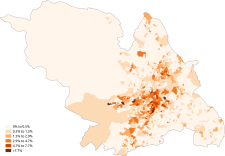
 Black-African
 -
 Black-Caribbean
 -
 Other-Arab


Ethnicity of school pupils[23]
| Ethnic group | School year | |
|---|---|---|
| 2021/2022 | ||
| Number | % | |
| White: Total | 55,144 | 65.9 |
| White: British | 50,144 | 59.8 |
| White: Irish | 131 | 0.2 |
| White: Traveller of Irish heritage | 55 | 0.1 |
| White: Gypsy/Roma | 1,739 | 2.1 |
| White: Other | 3,075 | 3.7 |
Asian / Asian British : Total
|
11,091 | 13.2 |
| Asian / Asian British: Indian | 875 | 1.0 |
| Asian / Asian British: Pakistani | 6,563 | 7.8 |
| Asian / Asian British: Bangladeshi | 1,016 | 1.2 |
| Asian / Asian British: Chinese | 629 | 0.8 |
| Asian / Asian British: Other Asians | 2,008 | 2.4 |
| Black / Black British: Total | 5,817 | 7 |
| Black: Caribbean | 474 | 0.6 |
| Black: African | 4,573 | 5.5 |
| Black: Other Blacks | 770 | 0.9 |
| Mixed / British Mixed | 7,097 | 8.5 |
| Other: Total | 3,246 | 3.9 |
| Unclassified | 1,433 | 1.7 |
| Total: | 83,828 | 100.0 |
Languages
The most common main languages spoken in Sheffield according to the 2011 census are shown below.[24]
| Rank | Language | Usual residents aged 3+ | Proportion |
|---|---|---|---|
| 1 | English | 490,407 | 92.15% |
| 2 | Arabic |
5,043 | 0.95% |
| 3 | Urdu |
4,222 | 0.79% |
| 4 | Punjabi | 2,743 | 0.52% |
| 5 | Polish | 2,611 | 0.49% |
| 6 | Somali | 2,074 | 0.39% |
| 7 | Bengali | 1,515 | 0.28% |
| 8 | Slovak | 1,244 | 0.23% |
| 9 | Persian | 1,017 | 0.19% |
| 10 | Kurdish | 960 | 0.18% |
| 11 | French | 922 | 0.17% |
| 12 | Spanish | 808 | 0.15% |
| 13 | Pashto |
807 | 0.15% |
| 14 | Mandarin Chinese | 609 | 0.11% |
| 15 | Turkish | 566 | 0.11% |
| 16 | Russian | 511 | 0.10% |
| 17 | Shona | 508 | 0.10% |
| 18 | Cantonese Chinese | 503 | 0.09% |
| 19 | Portuguese | 499 | 0.09% |
| 20 | Greek | 497 | 0.09% |
| Other | 14,098 | 2.65% |
Religion

The following table shows the religion of respondents in the 2001 and 2011 censuses in Sheffield.
| Religion | 2001[25] | 2011[26] | ||
|---|---|---|---|---|
| Number | % | Number | % | |
| Christian | 351,841 | 68.55% | 290,299 | 52.52% |
| Buddhist | 1,096 | 0.21% | 2,282 | 0.41% |
| Hindu | 1,675 | 0.33% | 3,566 | 0.65% |
| Jewish | 763 | 0.15% | 747 | 0.14% |
| Muslim | 23,819 | 4.64% | 42,801 | 7.74% |
| Sikh | 773 | 0.15% | 942 | 0.17% |
| Other religion | 1,215 | 0.24% | 1,961 | 0.35% |
| No religion | 91,894 | 17.90% | 172,516 | 31.21% |
| Religion not stated | 40,158 | 7.82% | 37,584 | 6.80% |
| Total | 513,234 | 100.00% | 552,698 | 100.00% |
-
 Christianity
 -
 Islam
Islam -
 Judaism
 -
 Hinduism
 -
 Sikhism
 -
 Buddhism
 -
 Other religion
 -
 No religion


See also
- List of famous residents of Sheffield
- Demographics of the United Kingdom
- Demographics of England
- Demographics of London
- Demographics of Birmingham
- Demographics of Greater Manchester
- List of English cities by population
- List of English districts by population
- List of English districts and their ethnic composition
- List of English districts by area
- List of English districts by population density
References
- ^ "Sheffield Resident Population Estimates by Ethnic Group and Sex, All Persons". National Statistics: Neighbourhood Statistics. Archived from the original on 30 August 2009. Retrieved 25 October 2009.
- ^ "Welcome to Sheffield | Demographics". Archived from the original on 5 June 2014. Retrieved 19 February 2014.
- ^ a b "Sheffield City Council - Population Estimates". Archived from the original on 21 February 2014. Retrieved 5 February 2014.
- ISBN 1-901587-18-5. It had largely died out by the time of the Survey of English Dialects.
- ^ "Yorkshire Dialect Words of Old Norse Origin". The Vikings. The Viking Network. Retrieved 5 January 2005.
- ^ Hunter, Joseph (1819). "Chapter I: Introductory Matter.—General Description". Hallamshire. The History and Topography of the Parish of Sheffield in the County of York. London: Lackington, Hughes, Harding, Mavor, and Jones.
- ISBN 1-874718-44-X.
- PMID 12157820.
- ^ Equality, Commission for Racial (1985). "Ethnic minorities in Britain: statistical information on the pattern of settlement". Commission for Racial Equality: Table 2.2.
- ^ Data is taken from United Kingdom Casweb Data services of the United Kingdom 1991 Census on Ethnic Data for England, Scotland and Wales Archived 5 April 2022 at the Wayback Machine (Table 6)
- ^ "Office of National Statistics; 2001 Census Key Statistics". webarchive.nationalarchives.gov.uk. Retrieved 7 September 2021.
- ^ "2011 Census: Ethnic Group, local authorities in England and Wales". webarchive.nationalarchives.gov.uk. Retrieved 15 December 2021.
- ^ "Ethnic group - Office for National Statistics". www.ons.gov.uk. Retrieved 29 November 2022.
- ^ "| FURD".
- ^ "Topic Report on Ethnic Origin". Sheffield City Council. Archived from the original on 24 November 2006. Retrieved 5 December 2006.
- ^ "Sources for the Study of Sheffield's Somali Community" (PDF). Sheffield Libraries Archives and Information. April 2011. p. 4. Archived from the original (PDF) on 22 June 2015. Retrieved 22 June 2015.
- ^ "The Somali Muslim Community in England: Understanding Muslim Ethnic Communities" (PDF). Department for Communities and Local Government. April 2009. p. 29. Archived from the original (PDF) on 19 September 2012. Retrieved 22 June 2015.
- ^ "Somali regions: Mapping exercise" (PDF). London: International Organization for Migration. June 2006. p. 6. Archived from the original (PDF) on 16 July 2011. Retrieved 22 June 2015.
- ^ "2011 Census: QS203EW Country of birth (detailed), local authorities in England and Wales". Office for National Statistics. 11 December 2012. Retrieved 22 June 2015.
- ^ "Ethiopia: Mapping exercise" (PDF). London: International Organization for Migration. November 2006. p. 24. Archived from the original (PDF) on 22 June 2015. Retrieved 22 June 2015.
- ^ Yemenis in spotlight – Sheffield Telegraph
- ^ Yemenis in Sheffield
- ^ "Schools, pupils and their characteristics, Academic Year 2021/22". explore-education-statistics.service.gov.uk. Retrieved 28 November 2022.
- ^ "Download:local authorities: county / unitary". NOMIS. Retrieved 5 September 2014.
- ^ "2001 census - theme tables". Retrieved 5 September 2014.
- ^ "Download:local authorities: county / unitary". NOMIS. Retrieved 2 September 2014.
External links
| About Sheffield | |||||
|---|---|---|---|---|---|
| Electoral wards |
| ||||
| Suburbs and estates |
| ||||
| Towns and villages |
| ||||
| Other areas | |||||