
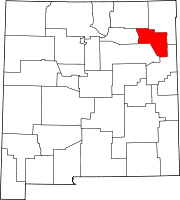
Harding County, New Mexico
Harding County | |
|---|---|
UTC−6 (MDT) | |
| Congressional district | 3rd |
| Website | www |
Harding County is a
The only incorporated cities in Harding County are Roy and Mosquero.
Geography
According to the
Adjacent counties
- Union County – northeast
- Quay County – southeast
- San Miguel County – south
- Mora County – west
- Colfax County – northwest
National protected area
- Kiowa National Grassland (part)
Demographics
| Census | Pop. | Note | %± |
|---|---|---|---|
| 1930 | 4,421 | — | |
| 1940 | 4,374 | −1.1% | |
| 1950 | 3,013 | −31.1% | |
| 1960 | 1,874 | −37.8% | |
| 1970 | 1,348 | −28.1% | |
| 1980 | 1,090 | −19.1% | |
| 1990 | 987 | −9.4% | |
| 2000 | 810 | −17.9% | |
| 2010 | 695 | −14.2% | |
| 2020 | 657 | −5.5% | |
| U.S. Decennial Census[5] 1790-1960[6] 1900-1990[7] 1990-2000[8] 2010[9] | |||
2000 census
As of the
There were 371 households, out of which 22.10% had children under the age of 18 living with them, 52.60% were married couples living together, 7.50% had a female householder with no husband present, and 37.50% were non-families. 35.30% of all households were made up of individuals, and 21.00% had someone living alone who was 65 years of age or older. The average household size was 2.18 and the average family size was 2.84.
In the county, the population was spread out, with 20.20% under the age of 18, 4.60% from 18 to 24, 18.80% from 25 to 44, 28.10% from 45 to 64, and 28.30% who were 65 years of age or older. The median age was 49 years. For every 100 females there were 102.50 males. For every 100 females age 18 and over, there were 102.50 males.
The median income for a household in the county was $26,111, and the median income for a family was $36,667. Males had a median income of $22,750 versus $15,750 for females. The
2010 census
As of the
Of the 349 households, 15.5% had children under the age of 18 living with them, 51.3% were married couples living together, 5.4% had a female householder with no husband present, 39.0% were non-families, and 34.7% of all households were made up of individuals. The average household size was 1.99 and the average family size was 2.49. The median age was 55.9 years.[11]
The median income for a household in the county was $33,750 and the median income for a family was $56,563. Males had a median income of $36,167 versus $29,111 for females. The per capita income for the county was $14,684. About 9.1% of families and 19.1% of the population were below the
Communities
Villages
Unincorporated communities
Politics
Harding County is conservative in presidential elections. It last supported a Democrat for president in 1948, and that was by a margin of just 4 votes.
| Year | Republican | Democratic | Third party | |||
|---|---|---|---|---|---|---|
| No. | % | No. | % | No. | % | |
| 2020 | 319 | 63.17% | 179 | 35.45% | 7 | 1.39% |
| 2016 | 311 | 59.01% | 156 | 29.60% | 60 | 11.39% |
| 2012 | 327 | 54.41% | 260 | 43.26% | 14 | 2.33% |
| 2008 | 358 | 57.19% | 260 | 41.53% | 8 | 1.28% |
| 2004 | 380 | 59.01% | 259 | 40.22% | 5 | 0.78% |
| 2000 | 366 | 61.72% | 214 | 36.09% | 13 | 2.19% |
| 1996 | 321 | 52.11% | 264 | 42.86% | 31 | 5.03% |
| 1992 | 312 | 46.02% | 268 | 39.53% | 98 | 14.45% |
| 1988 | 377 | 56.10% | 291 | 43.30% | 4 | 0.60% |
| 1984 | 401 | 63.55% | 224 | 35.50% | 6 | 0.95% |
| 1980 | 356 | 59.23% | 225 | 37.44% | 20 | 3.33% |
| 1976 | 387 | 57.08% | 285 | 42.04% | 6 | 0.88% |
| 1972 | 522 | 68.68% | 220 | 28.95% | 18 | 2.37% |
| 1968 | 450 | 57.69% | 284 | 36.41% | 46 | 5.90% |
| 1964 | 473 | 52.27% | 431 | 47.62% | 1 | 0.11% |
| 1960 | 616 | 60.87% | 396 | 39.13% | 0 | 0.00% |
| 1956 | 671 | 61.96% | 412 | 38.04% | 0 | 0.00% |
| 1952 | 760 | 63.49% | 436 | 36.42% | 1 | 0.08% |
| 1948 | 649 | 49.66% | 653 | 49.96% | 5 | 0.38% |
| 1944 | 820 | 55.90% | 647 | 44.10% | 0 | 0.00% |
| 1940 | 998 | 49.63% | 1,004 | 49.93% | 9 | 0.45% |
| 1936 | 888 | 40.94% | 1,276 | 58.83% | 5 | 0.23% |
| 1932 | 779 | 33.97% | 1,478 | 64.46% | 36 | 1.57% |
| 1928 | 916 | 55.72% | 726 | 44.16% | 2 | 0.12% |
| 1924 | 721 | 42.14% | 714 | 41.73% | 276 | 16.13% |
See also
References
- ^ "Harding County, New Mexico". United States Census Bureau. Retrieved July 3, 2023.
- ^ "Find a County". National Association of Counties. Retrieved June 7, 2011.
- ^ "What's in a County Name? Presidents' Day Edition". NBC News. Retrieved October 24, 2022.
- ^ "2010 Census Gazetteer Files". United States Census Bureau. August 22, 2012. Archived from the original on January 1, 2015. Retrieved January 2, 2015.
- ^ "U.S. Decennial Census". United States Census Bureau. Retrieved January 2, 2015.
- ^ "Historical Census Browser". University of Virginia Library. Retrieved January 2, 2015.
- ^ "Population of Counties by Decennial Census: 1900 to 1990". United States Census Bureau. Retrieved January 2, 2015.
- ^ "Census 2000 PHC-T-4. Ranking Tables for Counties: 1990 and 2000" (PDF). United States Census Bureau. Archived (PDF) from the original on March 27, 2010. Retrieved January 2, 2015.
- ^ "State & County QuickFacts". United States Census Bureau. Archived from the original on June 6, 2011. Retrieved September 29, 2013.
- ^ "U.S. Census website". United States Census Bureau. Retrieved January 31, 2008.
- ^ a b c "DP-1 Profile of General Population and Housing Characteristics: 2010 Demographic Profile Data". United States Census Bureau. Archived from the original on February 13, 2020. Retrieved January 24, 2016.
- ^ "Population, Housing Units, Area, and Density: 2010 - County". United States Census Bureau. Archived from the original on February 13, 2020. Retrieved January 24, 2016.
- ^ "DP02 SELECTED SOCIAL CHARACTERISTICS IN THE UNITED STATES – 2006-2010 American Community Survey 5-Year Estimates". United States Census Bureau. Archived from the original on February 13, 2020. Retrieved January 24, 2016.
- ^ "DP03 SELECTED ECONOMIC CHARACTERISTICS – 2006-2010 American Community Survey 5-Year Estimates". United States Census Bureau. Archived from the original on February 13, 2020. Retrieved January 24, 2016.
- ^ Leip, David. "Dave Leip's Atlas of U.S. Presidential Elections". uselectionatlas.org. Retrieved April 1, 2018.
Places adjacent to Harding County, New Mexico | ||||||||||||||||
|---|---|---|---|---|---|---|---|---|---|---|---|---|---|---|---|---|
| ||||||||||||||||
 | ||||
| Unincorporated communities | ||||
| Footnotes | ‡This populated place also has portions in an adjacent county or counties | |||
| ||||
35°52′N 103°49′W / 35.86°N 103.82°W
| International | |
|---|---|
| National | |