
Texas's 27th congressional district
| Texas's 27th congressional district | |||
|---|---|---|---|
 Texas's 27th congressional district - since January 3, 2023. | |||
| Representative |
| ||
| Distribution |
| ||
| Population (2022) | 771,898[2] | ||
| Median household income | $61,819[3] | ||
| Ethnicity |
| ||
| Cook PVI | R+13[4] | ||
Texas's 27th congressional district of the
special election on June 30, 2018, to replace former Republican representative Blake Farenthold, who had resigned on April 6.[5][6]
The 27th district was created as a result of the redistricting cycle after the 1980 census.
The district is slightly less than 50% Hispanic, down from the 70% Hispanic population in the 2002–2010 cycles when the district reached from Corpus Christi to Brownsville.[7]
In August 2017, a panel of federal judges ruled that the 27th district is unconstitutional, arguing that it displaces a Hispanic-opportunity district.United States Supreme Court later reversed the ruling, pronouncing the district constitutional in Abbott v. Perez.
Election results from presidential races
| Year | Office | Result |
|---|---|---|
| 2000 | President | Gore 49 – 48% |
| 2004 | President | Bush 55 – 45% |
| 2008 | President | Obama 53 - 46% |
| 2012 | President | Romney 61 – 38% |
| 2016 | President | Trump 60 – 36% |
| 2020 | President | Trump 61 – 37% |
List of members representing the district
| Member | Party | Years | Cong ress |
Electoral history | District location |
|---|---|---|---|---|---|
| District established January 3, 1983 | |||||
Solomon P. Ortiz )
(Corpus Christi |
Democratic | January 3, 1983 – January 3, 2011 |
98th 99th 100th 101st 102nd 103rd 104th 105th 106th 107th 108th 109th 110th 111th |
Re-elected in 2008 .Lost re-election. |
1983–1985 [data missing] |
| 1985–1993 [data missing] | |||||
| 1993–2003 Cameron, Kenedy, and Nueces; parts of Kleberg and Willacy | |||||
| 2003–2005 Cameron, Kenedy, and Willacy; parts of Kleberg and Nueces | |||||
2005–2013 Kenedy, Kleberg, Nueces, and Willacy; parts of Cameron and San Patricio | |||||
 Blake Farenthold (Corpus Christi) |
Republican | January 3, 2011 – April 6, 2018 |
112th 113th 114th 115th |
Re-elected in 2016 .Resigned. | |
2013–2023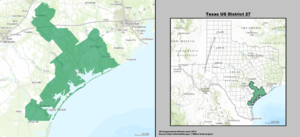 Aransas, Calhoun, Jackson, Lavaca, Matagorda, Nueces, Refugio, Victoria, and Wharton; parts of Bastrop, Caldwell, Gonzales, and San Patricio[9] | |||||
| Vacant | April 6, 2018 – June 30, 2018 |
115th | |||
 Michael Cloud (Victoria) |
Republican | June 30, 2018 – present |
115th 116th 117th 118th |
. | |
| 2023–present | |||||
Recent election results
| Party | Candidate | Votes | % | ±% | |
|---|---|---|---|---|---|
Democratic
|
Solomon Ortiz (incumbent) | 112,081 | 63.1 | +2.0 | |
Republican
|
William Vaden | 61,955 | 34.9 | -1.7 | |
Libertarian
|
Christopher Claytor | 3,500 | 2.0 | -0.4 | |
| Majority | 60,126 | 33.9 | |||
| Turnout | 177,536 | ||||
Democratic hold
|
Swing | +1.8 | |||
| Party | Candidate | Votes | % | ±% | |
|---|---|---|---|---|---|
Republican
|
Blake Farenthold | 50,954 | 47.85 | +12.95 | |
Democratic
|
Solomon Ortiz (incumbent) | 50,155 | 47.10 | -16.0 | |
| Majority | 799 | 0.75 | |||
| Turnout | 101,109 | ||||
Democratic
|
Swing | 28.95 | |||
| Party | Candidate | Votes | % | ±% | |
|---|---|---|---|---|---|
Republican
|
Blake Farenthold (incumbent) | 120,684 | 56.75 | +8.9 | |
Democratic
|
Rose Meza Harrison | 83,395 | 39.21 | -7.89 | |
Independent
|
Bret Baldwin | 5,354 | 2.51 | +2.51 | |
Libertarian
|
Corrie Byrd | 3,218 | 1.51 | +1.51 | |
| Turnout | 212,651 | ||||
| Party | Candidate | Votes | % | ±% | |
|---|---|---|---|---|---|
Republican
|
Blake Farenthold (incumbent) | 83,342 | 63.60 | +6.85 | |
Democratic
|
Wesley Reed | 44,152 | 33.69 | -5.52 | |
Libertarian
|
Roxanne Simonson | 3,553 | 2.71 | +1.2 | |
| Turnout | 131,047 | ||||
| Party | Candidate | Votes | % | ±% | |
|---|---|---|---|---|---|
Republican
|
Blake Farenthold (incumbent) | 142,251 | 61.69 | -1.91 | |
Democratic
|
Raul (Roy) Barrera | 88,329 | 38.31 | +4.62 | |
| Turnout | 230,580 | ||||
| Party | Candidate | Votes | % | |
|---|---|---|---|---|
| Republican | Michael Cloud | 19,856 | 54.74% | |
| Democratic | Eric Holguin | 11,595 | 31.96% | |
| Democratic | Raul (Roy) Barrera | 1,747 | 4.81% | |
| Republican | Bech Bruun (withdrawn) | 1,570 | 4.32% | |
| Republican | Marty Perez | 276 | 0.76% | |
| Democratic | Mike Westergren | 858 | 2.36% | |
Independent
|
Judith Cutright | 172 | 0.47% | |
| Libertarian | Daniel Tinus | 144 | 0.39% | |
Independent
|
Christopher Suprun | 51 | 0.14% | |
| Total votes | 36,268 | 100.0 | ||
| Party | Candidate | Votes | % | |
|---|---|---|---|---|
| Republican | Michael Cloud (incumbent) | 125,118 | 60.32 | |
| Democratic | Eric Holguin | 75,929 | 36.61 | |
| Libertarian | Daniel Tinus | 2,100 | 1.01 | |
Independent
|
James Duerr | 4,274 | 2.06 | |
| Total votes | 207,421 | 100 | ||
| Republican hold | ||||
| Party | Candidate | Votes | % | |
|---|---|---|---|---|
| Republican | Michael Cloud (incumbent) | 172,305 | 63.1 | |
| Democratic | Ricardo "Rick" De La Fuente | 95,446 | 34.9 | |
| Libertarian | Phil Gray | 5,482 | 2.0 | |
| Total votes | 273,253 | 100.0 | ||
| Republican hold | ||||
| Party | Candidate | Votes | % | |
|---|---|---|---|---|
| Republican | Michael Cloud (incumbent) | 133,416 | 64.4 | |
| Democratic | Maclovio Perez | 73,611 | 35.5 | |
| Total votes | 207,027 | 100.0 | ||
| Republican hold | ||||
Historical district boundaries
2005–2013

2013–2023
See also
References
- U.S. Census Bureau. Archived from the originalon April 2, 2013.
- ^ "My Congressional District".
- ^ "My Congressional District".
- ^ "2022 Cook PVI: District Map and List". Cook Political Report. Retrieved January 10, 2023.
- ^ Brufke, Juliegrace (April 6, 2018). "GOP Rep. Farenthold resigns amid sexual harassment scandal". The Hill. Retrieved April 6, 2018.
- ^ "Election Results: Texas Will Vote to Replace Congressman Who Retired Amid Scandal". The New York Times. June 30, 2018. Retrieved June 30, 2018.
- ^ Texas 27th District Profile The New York Times Accessed November 2010
- ^ "Federal court invalidates part of Texas congressional map" by Alexa Ura and Jim Malewitz, Texas Tribune, Aug. 15, 2017
- ^ "District Population Analysis with County Subtotals | CONGRESSIONAL DISTRICTS - PLANC2100" (PDF). Capitol Data Portal. Texas Legislative Council. August 26, 2021. Archived (PDF) from the original on June 27, 2022. Retrieved January 1, 2023.
- ^ "District Population Analysis with County Subtotals | CONGRESSIONAL DISTRICTS - PLANC2193" (PDF). Capitol Data Portal. Texas Legislative Council. October 17, 2021. Archived (PDF) from the original on December 25, 2022. Retrieved January 1, 2023.
- ^ "Office of the Secretary of State; Race Summary Report; 2012 General Election". Secretary of State of Texas. November 6, 2012. Archived from the original on November 8, 2006. Retrieved September 22, 2013.
- ^ "Office of the Secretary of State; Race Summary Report; 2014 General Election". Secretary of State of Texas. November 4, 2014. Retrieved April 6, 2018.
- ^ "Office of the Secretary of State; Race Summary Report; 2016 General Election". Secretary of State of Texas. November 8, 2014. Retrieved April 6, 2018.
- ^ "2018 Special Election, US Representative, District 27". Texas Secretary of State. Retrieved June 30, 2018.
- ^ "Texas Election Results". Texas Secretary of State. Retrieved December 5, 2018.
- ^ "Texas Election Results - Official Results". Texas Secretary of State. Retrieved November 26, 2020.
- ^ "Texas Election Night Results". Texas Department of State. Retrieved November 17, 2022.
- Martis, Kenneth C. (1989). The Historical Atlas of Political Parties in the United States Congress. New York: Macmillan Publishing Company.
- Congressional Biographical Directory of the United States 1774–present
External links
- 27th Congressional District of Texas Texas District 27 Information site.
28°46′59″N 96°50′29″W / 28.78306°N 96.84139°W
City of Corpus Christi | ||||||
|---|---|---|---|---|---|---|
| Education |
|  | ||||
| Military | ||||||
| Parks and recreation | ||||||
| Sports | ||||||
| Tourism | ||||||
| Transportation | ||||||
| Government | ||||||