
Texas's 24th congressional district
| Texas's 24th congressional district | |
|---|---|
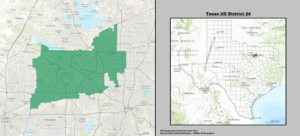
Interactive map of district boundaries since January 3, 2023 | |
| Representative | |
| Distribution |
|
| Population (2023) | 784,279[2] |
| Median household income | $114,631[2] |
| Ethnicity |
|
| Cook PVI | R+7[3] |


Texas' 24th congressional district of the
county line.The district has about 529,000 potential voters (citizens, age 18+). Of these, 57% are White, 16% Latino, 14% Black, and 10% Asian. Immigrants make up 4% of the district's potential voters. Median income among households (with one or more potential voter) in the district is about $81,900, and 46% hold a bachelor's or higher degree.[4]
It is the wealthiest congressional district in the state of Texas. [5]
Recent election results from statewide races
| Year | Office | Results[6] |
|---|---|---|
| 2008 | President | McCain 66% - 34% |
| 2012 | President | Romney 70% - 30% |
| 2014 | Senate | Cornyn 74% - 26% |
| Governor | Abbott 69% - 31% | |
| 2016 | President | Trump 59% - 35% |
| 2018 | Senate | Cruz 57% - 42% |
| Governor | Abbott 64% - 34% | |
| Lt. Governor | Patrick 58% - 39% | |
| Attorney General | Paxton 57% - 41% | |
| 2020 | President | Trump 55% - 43% |
| Senate | Cornyn 59% - 38% | |
| 2022 | Governor | Abbott 58% - 41% |
| Lt. Governor | Patrick 55% - 42% | |
| Attorney General | Paxton 55% - 41% | |
| Comptroller of Public Accounts | Hegar 61% - 37% | |
| 2024 | President | Trump 57% - 41% |
| Senate | Cruz 54% - 43% |
Composition
For the 118th and successive Congresses (based on redistricting following the 2020 census), the district contains all or portions of the following counties and communities:[7]
Dallas County (10)
- Addison (part; also 32nd), Carrollton (part; also 26th, 32nd, and 33rd; shared with Denton County), Coppell (part; also 26th; shared with Denton County), Dallas (part; also 3rd, 4th, 5th, 6th, 30th, 32nd, and 33rd; shared with Collin, Denton, Kaufman, and Rockwall counties), Farmers Branch (part; also 32nd and 33rd), Grapevine (shared with Denton and Tarrant counties), Highland Park, Lewisville (part; also 26th; shared with Denton County), Irving (part; also 6th and 33rd), Richardson (part; also 32nd; shared with Collin County), University Park
Tarrant County (14)
- Bedford, Colleyville, Euless, Flower Mound (part; also 26th; shared with Denton County), Fort Worth (part; also 12th, 25th, 26th, and 33rd; shared with Denton, Johnson, Parker, and Wise counties), Grapevine (shared with Dallas and Denton counties), Haltom City (part; also 12th), Hurst, Keller, Roanoke (part; also 26th; shared with Denton County), Southlake (part; also 26th; shared with Denton County), Trophy Club (part; also 26th; shared with Denton County), Watauga, Westlake (part; also 26th; shared with Denton County)
List of members representing the district


.jpg)

.jpg)

Recent election results
2024
|
2004
| Party | Candidate | Votes | % | ±% | |
|---|---|---|---|---|---|
Republican
|
Kenny Marchant | 154,435 | 64.0% | +30.0 | |
Democratic
|
Gary Page | 82,599 | 34.2% | −30.5 | |
Libertarian
|
James Lawrence | 4,340 | 1.8% | +0.4 | |
| Majority | 71,836 | ||||
| Turnout | 241,374 | 29.8% | |||
Democratic
|
Swing | +30.2 | |||
2006
| Party | Candidate | Votes | % | ±% | |
|---|---|---|---|---|---|
Republican
|
Kenny Marchant (incumbent) | 83,620 | 60.0% | −4.0 | |
Democratic
|
Gary Page | 51,833 | 37.0% | +2.8 | |
Libertarian
|
Mark Frohman | 4,211 | 3.0% | +1.2 | |
| Republican hold | |||||
2008
| Party | Candidate | Votes | % | ±% | |
|---|---|---|---|---|---|
Republican
|
Kenny Marchant (incumbent) | 151,740 | 55.91% | −4.09 | |
Democratic
|
Tom Love[11] | 111,649 | 41.14% | +4.14 | |
Libertarian
|
David A. Casey[12] | 7,969 | 2.93% | +0.13 | |
| Republican hold | |||||
2010
| Party | Candidate | Votes | % | ±% | |
|---|---|---|---|---|---|
Republican
|
Kenny Marchant (incumbent) | 81.6% | |||
Libertarian
|
David Sparks | 18.4% | |||
| Republican hold | |||||
2012
| Party | Candidate | Votes | % | ±% | |
|---|---|---|---|---|---|
Republican
|
Kenny Marchant (incumbent) | 61% | |||
Democratic
|
Tim Rusk | 36% | |||
Libertarian
|
John Stathas | 3% | |||
| Republican hold | |||||
2014
| Party | Candidate | Votes | % | ±% | |
|---|---|---|---|---|---|
Republican
|
Kenny Marchant (incumbent) | 93,446 | 65.1% | ||
Democratic
|
Patrick McGehearty | 46,360 | 32.3% | ||
Libertarian
|
Mike Kolls | 3,799 | 2.6% | ||
| Republican hold | |||||
2016
| Party | Candidate | Votes | % | ±% | |
|---|---|---|---|---|---|
Republican
|
Kenny Marchant (incumbent) | 154,364 | 56.2% | −8.9 | |
Democratic
|
Jan McDowell | 107,845 | 39.3% | +7.0 | |
Libertarian
|
Mike Kolls | 8,574 | 3.1% | +0.5 | |
| Republican hold | |||||
2018
| Party | Candidate | Votes | % | ±% | |
|---|---|---|---|---|---|
Republican
|
Kenny Marchant (incumbent) | 133,317 | 50.6% | −5.6 | |
Democratic
|
Jan McDowell | 125,231 | 47.5% | +8.2 | |
Libertarian
|
Mike Kolls | 4,870 | 1.8% | −1.3 | |
| Republican hold | |||||
2020
| Party | Candidate | Votes | % | ±% | |
|---|---|---|---|---|---|
Republican
|
Beth Van Duyne | 167,489 | 48.8% | −1.8 | |
Democratic
|
Candace Valenzuela | 162,846 | 47.5% | − | |
Libertarian
|
Darren Hamilton | 5,630 | 1.6% | −0.2 | |
| Independent | Steve Kuzmich | 4,218 | 1.2% | ||
| Independent | Mark Bauer | 2,903 | 0.8% | ||
| Total votes | 342,874 | 100.0% | |||
| Republican hold | |||||
2022
| Party | Candidate | Votes | % | ±% | |
|---|---|---|---|---|---|
Republican
|
Beth Van Duyne (incumbent) | 177,947 | 59.7% | +10.9 | |
Democratic
|
Jan McDowell
|
119,878 | 40.2% | −7.3 | |
| Total votes | 297,825 | 100.0% | |||
| Republican hold | |||||
2024
| Party | Candidate | Votes | % | |
|---|---|---|---|---|
| Republican | Beth Van Duyne (incumbent) | 227,108 | 60.30 | |
| Democratic | Sam Eppler | 149,518 | 39.70 | |
| Total votes | 376,626 | 100.00 | ||
| Republican hold | ||||
See also
References
- U.S. Census Bureau. Archived from the originalon April 2, 2013.
- ^ a b Center for New Media & Promotion (CNMP), US Census Bureau. "My Congressional District". www.census.gov.
- ^ "2025 Cook PVI℠: District Map and List (119th Congress)". Cook Political Report. Retrieved April 5, 2025.
- ^ "Representing US: 2020 Voter Profiles". APM Research Lab. Retrieved October 22, 2020.
- ^ Andrew DePietro (October 1, 2024). "The Richest Congressional Districts In Every State Of 2024". Forbes.
- ^ https://davesredistricting.org/maps#viewmap::1c2c1e0d-2fd1-43a8-a039-73e7023124d1
- ^ https://www2.census.gov/geo/maps/cong_dist/cd118/cd_based/ST48/CD118_TX24.pdf
- ^ "District Population Analysis with County Subtotals | CONGRESSIONAL DISTRICTS - PLANC2100" (PDF). Capitol Data Portal. Texas Legislative Council. August 26, 2021. Archived (PDF) from the original on June 27, 2022. Retrieved January 1, 2023.
- ^ "District Population Analysis with County Subtotals | CONGRESSIONAL DISTRICTS - PLANC2193" (PDF). Capitol Data Portal. Texas Legislative Council. October 17, 2021. Archived (PDF) from the original on December 25, 2022. Retrieved January 1, 2023.
- ^ 2008 Election Results accessed November 5, 2008
- ^ Tom Love 08 Archived September 3, 2008, at the Wayback Machine accessed May 25, 2008
- ^ David A. Casey for Congress accessed March 21, 2012
- ^ 2010 Election Results accessed April 5, 2013
- ^ 2012 Election Results accessed April 5, 2013
- ^ "Texas Election Results 2014: House Map by District, Live Midterm Voting Updates". Politico. Retrieved July 2, 2020.
- ^ "Texas Election Results 2016: House Live Map by District, Real-Time Voting Updates". Politico. Retrieved January 30, 2017.
- ^ "Texas' 24th Congressional District election, 2018". Ballotpedia. Retrieved March 5, 2019.[title missing]
- ^ "Texas' 24th Congressional District election, 2020". Ballotpedia. Retrieved November 10, 2020.
- ^ "Texas' 24th Congressional District election, 2022". Ballotpedia. Retrieved March 20, 2023.
- Texas Secretary of State. Retrieved January 11, 2025.
- Martis, Kenneth C. (1989). The Historical Atlas of Political Parties in the United States Congress. New York: Macmillan Publishing Company.
- Martis, Kenneth C. (1982). The Historical Atlas of United States Congressional Districts. New York: Macmillan Publishing Company.
- Congressional Biographical Directory of the United States 1774–present
Further reading
- Amber Phillips (September 25, 2020), "The House seats most likely to flip in November", Washingtonpost.com