
Texas's 1st congressional district
| Texas's 1st congressional district | |||
|---|---|---|---|
 Texas' 1st congressional district | |||
| Representative |
| ||
| Distribution |
| ||
| Population (2022) | 775,992[2] | ||
| Median household income | $60,999[2] | ||
| Ethnicity |
| ||
| Cook PVI | R+26[3] | ||
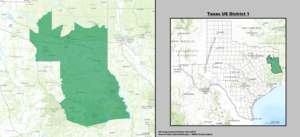
Texas' 1st congressional district in the United States House of Representatives serves the northeastern portion of the state of Texas. As of the 2000 census, the 1st district contained 651,619 people. It consists largely of three small East Texas metropolitan areas—Texarkana, Texas, Longview–Marshall, and Tyler. With a Cook Partisan Voting Index rating of R+26, it is the most Republican district in Texas.[3] It has been represented by Republican Nathaniel Moran since 2023.
The 1st district once encompassed large parts of North Texas and Central Texas, but as the population of Texas grew, the district got smaller until it only encompassed about half of Northeast Texas.
For most of its history, the district was based in
The district was predominantly rural for much of its history, and thus was far friendlier to electing
The district's best-known congressman, Wright Patman, represented the district for 47 years—the second-longest tenure of any Texan in Congress. He was an early supporter of the New Deal, and later chaired the House Banking Committee for 12 years.
2012 redistricting
The 2012 redistricting process changed the district's northern section. All of Marion County, Cass County, and most of Upshur County were removed from the district. To compensate, the eastern half of Wood County was added.[4] Prior to this, the district included a population of 651,619 in the 2000 census. Additionally, the population broke down accordingly:
- Under 18: 26.2%
- Over 65: 14.1%
- Married 58.7%
- Non-Hispanic White: 71%
- Black: 18%
- Hispanic: 9%
- Asian: 1%
- Foreign born: 5.3%
- Language other than English: 9.8%
- Median household income: $33,461
- Owner-occupied housing: 71.9%
- Income above $200K: 1.4%
Recent election results from statewide races
| Year | Race | Winner |
|---|---|---|
| 2000 | President | Bush 68–26% |
| 2004 | President | Bush 69–31% |
| 2008 | President | McCain 69–30% |
| 2012 | President | Romney 72–28% |
| 2016 | President | Trump 72–25% |
| 2018 | Senate | Cruz 72–28%[citation needed] |
| 2018 | Governor | Abbott 74–25%[citation needed] |
| 2020 | President | Trump 72–27% |
Recent election results
Election results from recent races:
U.S. Representative
| Party | Candidate | Votes | % | ±% | |
|---|---|---|---|---|---|
Republican
|
Louie Gohmert | 157,068 | 61.5 | ||
Democratic
|
Max Sandlin (incumbent) | 96,281 | 37.7 | ||
Libertarian
|
Dean Tucker | 2,158 | 0.8 | ||
| Majority | 60,787 | 23.8 | |||
| Turnout | 255,507 | ||||
Democratic
|
Swing | ||||
| Party | Candidate | Votes | % | ±% | |
|---|---|---|---|---|---|
Republican
|
Louie Gohmert (incumbent) | 104,099 | 68 | ||
Democratic
|
Roger L. Owen | 46,303 | 30.2 | ||
Libertarian
|
Donald Perkison | 2,668 | 1.7 | ||
| Majority | 57,796 | 37.8 | |||
| Turnout | 153,070 | ||||
Republican hold
|
Swing | ||||
| Party | Candidate | Votes | % | ±% | |
|---|---|---|---|---|---|
Republican
|
Louie Gohmert (incumbent) | 189,012 | 87.6 | ||
Independent
|
Roger L. Owen | 26,814 | 12.4 | ||
| Majority | 162,198 | 75.2 | |||
| Turnout | 215,826 | ||||
Republican hold
|
Swing | ||||
| Party | Candidate | Votes | % | ±% | |
|---|---|---|---|---|---|
Republican
|
Louie Gohmert (incumbent) | 129,398 | 89.7 | ||
Libertarian
|
Charles F. Parkes, III | 14,811 | 10.3 | ||
| Majority | 114,587 | 79.6 | |||
| Turnout | 144,209 | ||||
Republican hold
|
Swing | ||||
| Party | Candidate | Votes | % | ±% | |
|---|---|---|---|---|---|
Republican
|
Louie Gohmert (incumbent) | 178,322 | 71.4 | ||
Democratic
|
Shirley J. McKellar | 67,222 | 26.9 | ||
Libertarian
|
Clark Patterson | 4,114 | 1.6 | ||
| Majority | 111,100 | 44.5 | |||
| Turnout | 249,658 | ||||
Republican hold
|
Swing | ||||
| Party | Candidate | Votes | % | ±% | |
|---|---|---|---|---|---|
Republican
|
Louie Gohmert (incumbent) | 115,084 | 77.5 | ||
Democratic
|
Shirley J. McKellar | 33,476 | 22.5 | ||
| Majority | 81,608 | 55 | |||
| Turnout | 148,560 | ||||
Republican hold
|
Swing | ||||
| Party | Candidate | Votes | % | ±% | |
|---|---|---|---|---|---|
Republican
|
Louie Gohmert (incumbent) | 192,434 | 73.9 | ||
Democratic
|
Shirley J. McKellar | 62,847 | 24.1 | ||
Libertarian
|
Phil Gray | 5,062 | 1.9 | ||
| Majority | 129,587 | 49,8 | |||
| Turnout | 260,343 | ||||
Republican hold
|
Swing | ||||
| Party | Candidate | Votes | % | ±% | |
|---|---|---|---|---|---|
Republican
|
Louie Gohmert (incumbent) | 168,165 | 72.26 | ||
Democratic
|
Shirley J. McKellar | 61,263 | 26.32 | ||
Libertarian
|
Jeff Callaway | 3,292 | 0.5 | ||
Republican hold
|
Swing | ||||
| Party | Candidate | Votes | % | ±% | |
|---|---|---|---|---|---|
Republican
|
Louie Gohmert (incumbent) | 218,385 | 72.61 | ||
Democratic
|
Hank Gilbert | 82,359 | 27.39 | ||
Republican hold
|
Swing | ||||
| Party | Candidate | Votes | % | ±% | |
|---|---|---|---|---|---|
Republican
|
Nathaniel Moran | 183,224 | 78.08 | ||
Democratic
|
Jrmar Jefferson | 51,438 | 21.92 | ||
Republican hold
|
Swing | ||||
List of members representing the district
.jpg)


.jpg)
.jpg)
.jpg)


See also
References
- U.S. Census Bureau. Archived from the originalon April 2, 2013. Retrieved February 7, 2018.
- ^ a b "My Congressional District".
- ^ a b "2022 Cook PVI: District Map and List". Cook Political Report. Retrieved January 10, 2023.
- ^ "Home". gis1.tlc.state.tx.us.
- ^ a b c d e f g h i Until 1872, Texas (like some other states) held its congressional elections after the March 4 beginning of the term but before the December date on which Congress began its formal business. Such elections are denoted here as "late".
- ^ "Historical Maps (1846–2012)". Texas Redistricting. Texas Legislative Council.
- ^ Acts 1846, 1st Leg., R.S., eff. Feb. 28, 1846.
- ^ Acts 1850, 3rd Leg., R.S., Ch. 134, app. Feb. 11, 1850.
- ^ a b Constitution of the State of Texas (1869)
- ^ Acts 1874, 14th Leg., R.S., Ch. 161, eff. May 2, 1874.
- ^ Acts 1879, 16th Leg., R.S., Ch. 102, eff. Apr. 18, 1879.
- ^ Acts 1882, 17th Leg., 1st C.S., Ch. 30, eff. Aug. 3, 1882.
- ^ Acts 1892, 22nd Leg., 1st C.S., Ch. 19, eff. Jul. 11, 1892.
- ^ United States v. Texas, 162 U.S. 1 (1896)
- ^ Acts 1901, 27th Leg., 1st C.S., Ch. 5, eff. Dec. 3, 1901
- ^ a b c Acts 1909, 31st Leg., R.S., Ch. 86, eff. Jun. 11, 1909.
- ^ a b Acts 1917, 35th Leg., R.S., Ch. 119, eff. Jun. 19, 1917.
- ^ Acts 1933, 43rd Leg., R.S., Ch. 135, eff. Aug. 30, 1933.
- ^ Acts 1957, 55th Leg., R.S., Ch. 286, eff. Aug. 21, 1957;
Bush v. Martin, 224 F. Supp. 499 (S.D. Tex. 1963);
aff'd per curiam, Martin v. Bush, 376 U.S. 222 (1964);
Acts 1965, 59th Leg., R.S., Ch. 349, eff. Aug. 30, 1965. - ^ Acts 1967, 60th Leg., R.S., Ch. 342, eff. Aug. 28, 1967;
Bush v. Martin, 251 F. Supp. 484 (S.D. Tex. 1966). - ^ Acts 1971, 62nd Leg. 1st C.S., Ch. 12, eff. Sep. 3, 1971.
- ^ White v. Weiser, --- F. Supp. --- (N.D. Tex. 1973) PLAN B
- ^ Acts 1975, 64th Leg., R.S., Ch. 538, eff. Sep. 1, 1975.
- ^ Acts 1981, 67th Leg., 1st C.S., Ch. 2, eff. Nov. 10, 1981;
Seamon v. Upham, 536 F. Supp. 931, 958 (E.D. Tex. 1982);
Acts 1983, 68th Leg., R.S., Ch. 531, eff. Jun. 19, 1983. - ^ Acts 1991, 72nd Leg., 2nd C.S., Ch. 7, eff. Nov. 24, 1991;
Vera v. Richards, 861 F. Supp. 1304 (S.D. Tex. 1994);
Bush v. Vera, 517 U.S. 952 (1996);
Vera v. Bush, 933 F. Supp. 1341 (S.D. Tex. 1996) PLANC657 - ^ Vera v. Bush, 933 F. Supp. 1341 (S.D. Tex. 1996);
Vera v. Bush, 980 F. Supp. 254 (S.D. Tex. 1997) PLANC746 - ^ Balderas v. State of Texas, --- F. Supp. --- (E.D. Tex. 2001) PLAN01151C
- ^ Acts 2003, 78th Leg., 3rd C.S., Ch. 2, eff. Jan. 11, 2004 PLAN01374C;
Lulac v. Perry, 457 F. Supp. 2d 716 (E.D. Tex. 2006) PLAN01440C. - ^ "District Population Analysis with County Subtotals | CONGRESSIONAL DISTRICTS - PLANC2100" (PDF). Capitol Data Portal. Texas Legislative Council. August 26, 2021. Archived (PDF) from the original on June 27, 2022. Retrieved January 1, 2023.
- ^ "District Population Analysis with County Subtotals | CONGRESSIONAL DISTRICTS - PLANC2193" (PDF). Capitol Data Portal. Texas Legislative Council. October 17, 2021. Archived (PDF) from the original on December 25, 2022. Retrieved January 1, 2023.
- Martis, Kenneth C. (1989). The Historical Atlas of Political Parties in the United States Congress. New York: Macmillan Publishing Company.
- Martis, Kenneth C. (1982). The Historical Atlas of United States Congressional Districts. New York: Macmillan Publishing Company.
- Congressional Biographical Directory of the United States 1774–present