
Arizona's 2nd congressional district
| Arizona's 2nd congressional district | |||
|---|---|---|---|
Interactive map of district boundaries since January 3, 2023 | |||
| Representative |
| ||
| Area | 20,219 sq mi (52,370 km2) | ||
| Distribution |
| ||
| Population (2022) | 820,500[1] | ||
| Median household income | $62,015[1] | ||
| Ethnicity |
| ||
| Cook PVI | R+6[2] | ||

Arizona's 2nd congressional district is a congressional district located in the U.S. state of Arizona. The district is in the north eastern part of the state and includes Apache, Coconino, Gila, Navajo, and Yavapai counties in their entirety and portions of Graham, Maricopa, Mohave, and Pinal counties. The largest city in the district is Flagstaff.
Before January 2023, Arizona's second congressional district was located in the southeastern corner of the state and included Cochise county and eastern Pima county drawing most of its population from the city of
The district includes 12 Native American reservations including the
History
When Arizona was divided into congressional districts for the first time after the 1950 census, the 2nd district comprised the entire state outside of the
The 2nd district remained based in southern Arizona until the 2000 census, when Arizona picked up two districts. At that time, the old 2nd district essentially became the new
counties.The size and diversity of the 2nd district (it included nearly all of the northwestern portion of the state) made it appear rural on a map. However, over 90 percent of its population lived in the strongly conservative West Valley, historically a fairly safe Republican area.
The odd shape of the district was indicative of the use of
After the 2012 census, the bulk of the Maricopa County portion of the old 2nd became the 8th district, while the new 2nd district took in most of the territory of the old 8th district. That district, in turn, had been the 5th district from 1983 to 2003. In the 2014 midterms, the district was the last House of Representatives race to be decided, as the official recount began on December 1 due to Republican Martha McSally leading incumbent Democratic congressman Ron Barber by fewer than 200 votes. Ultimately, Barber lost to McSally by 167 votes.
Main industries
Primary job fields of the people in the district include agriculture, ranching, livestock, mining, and tourism. The main irrigated crops are
Schools
Located within the district is Northern Arizona University, Diné College, Yavapai College, Prescott College, and Embry–Riddle Aeronautical University.
Tourism and recreation
Tourism is an important industry as the district has numerous natural wonders, national forests, parks, and conservation areas. Grand Canyon and Petrified Forest National Parks highlight the public lands in the district. Other prominent tourist attractions include
The Apache-Sitgraves, Coconino, Kaibab, Prescott, and Tonto National forests are most or partially in the district. The Oak Flat (Arizona) site is also within the second district.
Composition
| # | County | Seat | Population |
|---|---|---|---|
| 1 | Apache | St. Johns | 65,036 |
| 5 | Coconino | Flagstaff | 144,472 |
| 7 | Gila | Globe | 54,003 |
| 9 | Graham | Safford | 39,525 |
| 13 | Maricopa | Phoenix | 4,585,871 |
| 15 | Mohave | Kingman | 223,682 |
| 17 | Navajo | Holbrook | 109,175 |
| 21 | Pinal | Florence | 484,239 |
| 25 | Yavapai | Prescott | 249,081 |
Cities of 10,000 people or more
- Peoria – 190,985
- Flagstaff – 76,831
- Maricopa – 66,290
- Casa Grande – 53,659
- Prescott Valley – 46,785
- Prescott – 45,827
- Florence – 26,785
- Payson – 16,361
- Coolidge – 13,218
- Chino Valley – 13,020
- Camp Verde – 12,147
- Cottonwood – 12,029
- Verde Village – 12,019
- Show Low – 11,732
- Gold Canyon – 11,404
2,500 – 10,000 people
- Sedona – 9,684
- Winslow – 9,005
- Tuba City – 8,072
- Wickenburg – 7,474
- Page – 7,440
- Globe – 7,249
- Williamson – 6,196
- Village of Oak Creek – 6,128
- Snowflake – 6,104
- Paulden – 5,567
- Lake Montezuma – 5,111
- Holbrook – 4,858
- Kayenta – 4,670
- Chinle – 4,573
- Whiteriver – 4,520
- Clarkdale – 4,424
- Eagar – 4,395
- Dewey-Humboldt – 4,326
- Pinetop–Lakeside – 4,030
- Taylor – 3,995
- San Carlos – 3,987
- Doney Park – 3,894
- Lake of the Woods – 3,648
- Fort Defiance – 3,541
- St. Johns – 3,417
- Cornville – 3,362
- Sacaton – 3,254
- Williams – 3,202
- Heber-Overgaard – 2,898
- Cordes Lakes – 2,684
- Black Canyon City – 2,677
- Linden – 2,597
- Timberline-Fernwood – 2,572
- Kachina Village – 2,502
- Window Rock – 2,500
Voting
| Election results from presidential races | ||
|---|---|---|
| Year | Office | Results |
| 2000 | President | Gore 56 - 41% |
| 2004 | President | Bush 61 - 38% |
| 2008 | President | McCain 61 - 38% |
| 2012 | President | Romney 50 - 48% |
| 2016 | President | Clinton 50 - 45% |
| 2020 | President | Biden 55 - 44% |
List of members representing the district
Starting with the
| Representative | Party | Term | Cong ress(es) |
Electoral history | Geography and counties[5][6][7] |
|---|---|---|---|---|---|
| District created January 3, 1949 | |||||
 Harold Patten (Tucson) |
Democratic | January 3, 1949 – January 3, 1955 |
81st 82nd 83rd |
Re-elected in 1952 .Retired. |
1949–1963: All except Maricopa |
 Stewart Udall (Tucson) |
Democratic | January 3, 1955 – January 21, 1961 |
84th 85th 86th 87th |
Re-elected in 1960. .
Resigned to become U.S. Secretary of the Interior | |
| Vacant | January 21, 1961 – May 2, 1961 |
87th | |||
.jpg) Mo Udall (Tucson) |
Democratic | May 2, 1961 – May 4, 1991 |
87th 88th 89th 90th 91st 92nd 93rd 94th 95th 96th 97th 98th 99th 100th 101st 102nd |
Re-elected in 1990 .Resigned due to health reasons. | |
| 1963–1973: South Arizona, including Tucson: Cochise, Pima, Pinal, Santa Cruz, Yuma | |||||
| 1973–1983: Cochise, Pima, Santa Cruz, Maricopa (part), Pinal (part) | |||||
| 1983–1993: Southwest Arizona, including parts of (part) | |||||
| Vacant | May 4, 1991 – October 3, 1991 |
102nd | |||
 Ed Pastor (Phoenix) |
Democratic | October 3, 1991 – January 3, 2003 |
102nd 103rd 104th 105th 106th 107th |
Re-elected in 1992. .
Re-elected in 1994. Re-elected in 1996. Re-elected in 1998. Re-elected in 2000. Redistricted to the 4th district | |
| 1993–2003: Southwest Arizona, including parts of (part) | |||||
 Trent Franks (Phoenix) |
Republican | January 3, 2003 – January 3, 2013 |
108th 109th 110th 111th 112th |
First elected in 2002. Re-elected in 2004. Re-elected in 2006. Re-elected in 2008. Re-elected in 2010. Redistricted to the 8th district. |
2003–2013: (part) |
 Ron Barber (Tucson) |
Democratic | January 3, 2013 – January 3, 2015 |
113th | Redistricted from the 8th district and re-elected in 2012. Lost re-election. |
2013–2023: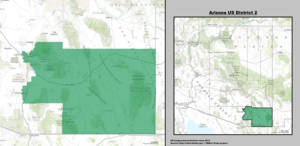 Southeastern Arizona: Cochise, Pima (part) |
.jpg) Martha McSally (Tucson) |
Republican | January 3, 2015 – January 3, 2019 |
114th 115th |
Elected in 2014. Re-elected in 2016. Retired to run for U.S. Senator. | |
 Ann Kirkpatrick (Tucson) |
Democratic | January 3, 2019 – January 3, 2023 |
116th 117th |
Elected in 2018. Re-elected in 2020. Redistricted to the 6th district and retired. | |
 Eli Crane (Oro Valley) |
Republican | January 3, 2023 – present |
118th | Elected in 2022. | 2023–present:.svg) Northeastern Arizona: Apache, Coconino, Gila, Graham(part), Maricopa(part), Mohave(part), Navajo, Pinal (part), Yavapai |
Recent election results
2002
| Party | Candidate | Votes | % | ±% | |
|---|---|---|---|---|---|
| Republican | Trent Franks | 100,359 | 59.92% | ||
| Democratic | Randy Camacho | 61,217 | 36.55% | ||
| Libertarian | Edward Carlson | 5,919 | 3.53% | ||
| Majority | 39,142 | 23.37% | |||
| Total votes | 167,502 | 100.00 | |||
| Republican hold | |||||
2004
| Party | Candidate | Votes | % | ±% | |
|---|---|---|---|---|---|
| Republican | Trent Franks* (incumbent) | 165,260 | 59.17% | ||
| Democratic | Randy Camacho | 107,406 | 38.46% | ||
| Libertarian | Powell Gammill | 6,625 | 2.37% | ||
| Majority | 57,854 | 20.71% | |||
| Total votes | 279,303 | 100.00 | |||
| Republican hold | |||||
2006
| Party | Candidate | Votes | % | ±% | |
|---|---|---|---|---|---|
| Republican | Trent Franks* (incumbent) | 135,150 | 58.62% | ||
| Democratic | John Thrasher | 89,671 | 38.89% | ||
| Libertarian | Powell Gammill | 5,734 | 2.49% | ||
| Majority | 45,479 | 19.73% | |||
| Total votes | 230,560 | 100.00 | |||
| Republican hold | |||||
2008
| Party | Candidate | Votes | % | ±% | |
|---|---|---|---|---|---|
| Republican | Trent Franks* (incumbent) | 200,914 | 59.44% | ||
| Democratic | John Thrasher | 125,611 | 37.16% | ||
| Libertarian | Powell Gammill | 7,882 | 2.33% | ||
Green
|
William Crum
|
3,616 | 1.07% | ||
| Majority | 75,303 | 22.28% | |||
| Total votes | 338,023 | 100.00 | |||
| Republican hold | |||||
2010
| Party | Candidate | Votes | % | ±% | |
|---|---|---|---|---|---|
| Republican | Trent Franks* (incumbent) | 173,173 | 64.89% | ||
| Democratic | John Thrasher | 82,891 | 31.06% | ||
| Libertarian | Powell Gammill | 10,820 | 4.05% | ||
| Majority | 90,282 | 33.83% | |||
| Total votes | 266,884 | 100.00 | |||
| Republican hold | |||||
2012
| Party | Candidate | Votes | % | ±% | |
|---|---|---|---|---|---|
| Democratic | Ron Barber* | 147,338 | 50.41% | ||
| Republican | Martha McSally | 144,884 | 49.57% | ||
| Write-In | Write-ins | 57 | 0.02% | ||
| Majority | 2,454 | 0.84% | |||
| Total votes | 292,279 | 100.00 | |||
| Democratic gain from Republican | |||||
2014
| Party | Candidate | Votes | % | ±% | |
|---|---|---|---|---|---|
| Republican | Martha McSally | 109,704 | 49.81% | ||
| Democratic | Ron Barber* (incumbent) | 109,583 | 49.75% | ||
| Write-In | Write-ins | 1,007 | 0.46% | ||
| Majority | 121 | 0.06% | |||
| Total votes | 220,254 | 100.00% | |||
| Republican gain from Democratic | |||||
2016
| Party | Candidate | Votes | % | ±% | |
|---|---|---|---|---|---|
| Republican | Martha McSally* (incumbent) | 179,806 | 56.96% | ||
| Democratic | Matt Heinz | 135,873 | 43.04% | ||
| Majority | 43,933 | 13.92% | |||
| Total votes | 315,679 | 100% | |||
| Republican hold | |||||
2018
| Party | Candidate | Votes | % | ±% | |
|---|---|---|---|---|---|
| Democratic | Ann Kirkpatrick | 161,000 | 54.73% | +11.69% | |
| Republican | Lea Márquez Peterson | 133,083 | 45.24% | -11.72% | |
| Margin of victory | 27,917 | 9.49% | +23.41% | ||
| Total votes | 294,083 | 100.0% | N/A | ||
| Democratic gain from Republican | |||||
2020
| Party | Candidate | Votes | % | |
|---|---|---|---|---|
| Democratic | Ann Kirkpatrick* (incumbent) | 209,945 | 55.1% | |
| Republican | Brandon Martin | 170,975 | 44.9 | |
| Write-In | Write-ins | 134 | 0.0 | |
| Total votes | 381,054 | 100.0 | ||
| Democratic hold | ||||
2022
| Party | Candidate | Votes | % | |||
|---|---|---|---|---|---|---|
| Republican | Eli Crane | 174,169 | 53.9 | |||
| Democratic | Tom O'Halleran (incumbent) | 149,151 | 46.1 | |||
| Independent | Chris Sarappo (write-in) | 76 | 0.0 | |||
| Total votes | 323,396 | 100.0 | ||||
| Republican gain from Democratic | ||||||
See also
References
- ^ a b "My Congressional District". www.census.gov. US Census Bureau. Retrieved October 5, 2023.
- ^ "2022 Cook PVI: District Map and List". Cook Political Report. Retrieved January 10, 2023.
- ^ https://redistricting-irc-az.hub.arcgis.com/pages/final-draft-maps#finalcddraftmaps
- Arizona Republic, Published September 16, 2011. Retrieved November 3, 2011.
- ^ Martis, Kenneth C. (1982). The Historical Atlas of United States Congressional Districts, 1789-1983. New York: Macmillan Publishing.
- ^ Martis, Kenneth C. (1989). The Historical Atlas of Political Parties in the United States Congress, 1789-1989. New York: Macmillan Publishing.
- ^ Congressional Directory: Browse 105th Congress Archived February 17, 2011, at the Wayback Machine
- ^ "2018 General Election". Arizona Secretary of State. November 15, 2018.
External links
- Maps of Congressional Districts first in effect for the 2002 election
- Tentative Final Congressional Maps for the 2012 election
- Demographic data from census.gov
- 2004 Election data from CNN.com
- 2002 Election data from CBSNews.com
- 2000 Election data from CNN.com
- 1998 Election data from CNN.com
- full listing of candidates, via Arizona Secretary of State's office
- Rose Institute of State and Local Government, "Arizona: 2010 Redistricting Changes: Second District", Redistricting by State, Claremont, CA: Claremont McKenna College, archived from the original on September 15, 2020