Federal electoral district in Alberta, Canada
Edmonton West (French : Edmonton-Ouest electoral district in Alberta , Canada, that was represented in the House of Commons of Canada from 1917 to 1988, from 1997 to 2004 and again since 2015.
Demographics
Population, 2011
104,422
Electors
78,293
Area (km²)
105
Population density (people per km²)
994
Panethnic groups in Edmonton West (2011−2021)
Panethnic 2021[3]
2016[4]
2011[5]
Pop. %
Pop.
%
Pop.
%
European [a] 70,850
70,975
69,285
Southeast Asian [b] 21,410
15,490
9,705
East Asian [c] 8,320
7,955
6,825
Indigenous
7,885
7,145
5,080
South Asian
7,390
6,285
3,820
African
7,280
4,995
3,180
Middle Eastern [d] 4,370
3,350
2,475
Latin American
1,975
1,650
1,175
Other/Multiracial [e]
2,740
2,010
1,310
Total responses
132,220
119,845
102,850
Total population
134,194
121,869
104,422
Notes: Totals greater than 100% due to multiple origin responses.2012 Canadian federal electoral redistribution riding boundaries.
History and geography This riding was first created in 1914 from Edmonton riding . Originally, this was a vast rural district including most of the northwestern quadrant of the province of Alberta and a portion of the city of Edmonton : the area north of the North Saskatchewan River and west of 101st Street.[6]
In 1924, it took in parts of the now-abolished Strathcona riding that had been within Edmonton city limits. It took in the southside area lying west of 103rd Street.[7]
In 1924 the northern rural sections were also separated to form the ridings of
Athabasca
.
In 1933 the more southerly portions became
Pembina
in 1966.
The urban part of riding similarly shrank over time as Edmonton's population expanded and new districts were spun off from Edmonton West. Parts of Edmonton West were lost to Edmonton—Strathcona (in 1952), Edmonton Centre (for the first time in 1966), and Edmonton North (in 1976). However, it also gained area from the (temporary) abolition of Edmonton Centre in 1976.
Edmonton West was abolished in 1987 when it was redistributed into Edmonton Northwest and Edmonton Southwest ridings. It was re-created in 1996 from the abolished Edmonton Northwest and redrawn Edmonton Southwest ridings.
Edmonton West was abolished again in 2003 and transferred mostly into the re-formed Edmonton Centre, with a smaller portion going into Edmonton—Spruce Grove . It was re-created by the 2012 Canadian federal electoral redistribution from parts of the abolished Edmonton—Spruce Grove and redrawn Edmonton Centre.
Historical boundaries
1914 representation order
1924 representation order
1933 representation order
1952 representation order
1966 representation order
1976 representation order
1996 representation order
2013 representation order
Members of Parliament This riding has elected the following members of the House of Commons of Canada :
Election results 2015–present Graph of election results in Edmonton West (since 2015, minor parties that never got 2% of the vote or didn't run consistently are omitted)
2021 Canadian federal election
Party
Candidate
Votes
%
Expenditures
Conservative Kelly McCauley 25,278
45.15
-15.75
$70,547.20
New Democratic Sandra Hunter
14,190
25.34
+10.74
$4,137.83
Liberal Adam Wilson Brown
13,016
23.25
+3.15
$32,707.12
People's Brent Kinzel
3,354
5.99
+4.09
$7,424.40
Marxist–Leninist Peggy Morton
151
0.27
-
$0.00
Total valid votes/Expense limit
55,989 – – $118,977.75
Total rejected ballots
302
Turnout
56,291
Eligible voters
90,594
Conservative hold
Swing
-13.25
Source: Elections Canada [8] [9]
2019 Canadian federal election
Party
Candidate
Votes
%
Expenditures
Conservative Kelly McCauley 35,719
60.9
+11.57
$53,447.12
Liberal Kerrie Johnston
11,812
20.1
-14.79
$13,516.82
New Democratic Patrick Steuber
8,537
14.6
+1.59
none listed
Green Jackie Pearce
1,441
2.5
+0.56
none listed
People's Matthew Armstrong
1,126
1.9
-
$1,582.21
Total valid votes/expense limit
58,635 100.0
Total rejected ballots
304
Turnout
58,939 66.6
Eligible voters
88,508
Conservative hold
Swing
+13.18
Source: Elections Canada [10] [11]
1997–2004 Graph of election results in Edmonton West (1996-2003, minor parties that never got 2% of the vote or didn't run consistently are omitted)
2000 Canadian federal election
Party
Candidate
Votes
%
Expenditures
Liberal Anne McLellan 21,978
44.24%
–
$65,989
Alliance Betty Unger 21,245
42.76%
–
$66,378
Progressive Conservative Rory J. Koopmans
3,009
6.05%
–
$5,622
New Democratic Richard D. Vanderberg
2,895
5.82%
–
$10,850
Canadian Action Dan Parker
354
0.71%
–
$1,157
Marxist–Leninist Peggy Morton
194
0.39%
–
Total valid votes
49,675 100.00%
Total rejected ballots
169 0.34%
Turnout
49,844 56.29%
1997 Canadian federal election
Party
Candidate
Votes
%
Expenditures
Liberal Anne McLellan 17,802
43.44%
–
$56,082
Reform Dean Charles Kurpjuweit
16,392
40.00%
–
$52,778
New Democratic Duane Good Striker
3,386
8.26%
–
$15,860
Progressive Conservative Helen Stephenson
2,919
7.12%
–
$10,441
Green Roger Swan
210
0.51%
–
$354
Natural Law Sam Thomas
143
0.34%
–
Marxist–Leninist Peggy Morton
122
0.29%
–
Total valid votes
40,974 100.00%
Total rejected ballots
130 0.32%
Turnout
41,104 54.43%
1917–1988
By-election on 2 November 1926
Acceptance by the Honourable Charles Stewart of an office of emoulment under the Crown, 5 October 1926
Party
Candidate
Votes
Liberal Charles Stewart acclaimed
The vote tallies recorded here are the final ones after Army votes were added.
Votes cast actually in Edmonton had Oliver the winner by more than 100 votes.[15]
See also Notes
^ Statistic includes all persons that did not make up part of a visible minority or an indigenous identity.
^ Statistic includes total responses of "Filipino" and "Southeast Asian" under visible minority section on census.
^ Statistic includes total responses of "Chinese", "Korean", and "Japanese" under visible minority section on census.
^ Statistic includes total responses of "West Asian" and "Arab" under visible minority section on census.
^ Statistic includes total responses of "Visible minority, n.i.e. " and "Multiple visible minorities" under visible minority section on census.
References
^ Statistics Canada : 2011^ Statistics Canada : 2011^ Government of Canada, Statistics Canada (October 26, 2022). "Census Profile, 2021 Census of Population" . www12.statcan.gc.ca . Retrieved April 1, 2023 . ^ Government of Canada, Statistics Canada (October 27, 2021). "Census Profile, 2016 Census" . www12.statcan.gc.ca . Retrieved April 1, 2023 . ^ Government of Canada, Statistics Canada (November 27, 2015). "NHS Profile" . www12.statcan.gc.ca . Retrieved April 1, 2023 . ^ "Profile" .^ "Profile" .^ "September 20, 2021 Election Results — Edmonton Manning (Validated results)" . Elections Canada . September 26, 2021. Retrieved October 21, 2021 .^ "List of confirmed candidates – September 20, 2021 Federal Election" . Elections Canada . Retrieved September 2, 2021 .^ "List of confirmed candidates" . Elections Canada . Retrieved October 4, 2019 .^ "Election Night Results" . Elections Canada. Retrieved November 7, 2019 .^ "October 19, 2015 Election Results — Edmonton West (Validated results)" . Elections Canada . October 21, 2015. Retrieved November 4, 2015 .^ Elections Canada – Preliminary Election Expenses Limits for Candidates Archived 2015-08-15 at the Wayback Machine ^ Pundits' Guide to Canadian Elections ^ Edmonton Bulletin, Jan 11, 1918
External links

 1914 representation order
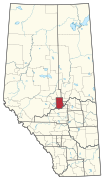 1924 representation order
 1933 representation order
 1952 representation order
 1966 representation order
 1976 representation order
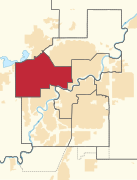 1996 representation order
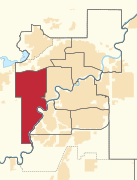 2013 representation order


