
Mobile County, Alabama
30°47′11″N 88°12′50″W / 30.78639°N 88.21389°W
Mobile County | |
|---|---|
 Mobile Government Plaza in Mobile | |
|
UTC−5 (CDT) | |
| Congressional district | 1st |
| Website | mobilecountyal |
| |
Mobile County (/moʊˈbiːl/ moh-BEEL) is located in the southwestern corner of the U.S. state of Alabama. It is the third-most populous county in the state after Jefferson and Madison counties. As of the 2020 census, its population was 414,809.[2] Its county seat is Mobile, which was founded as a deepwater port on the Mobile River. The only such port in Alabama, it has long been integral to the economy for providing access to inland waterways as well as the Gulf of Mexico.[3]
The city, river, and county were named in honor of Maubila, a village of the paramount chief Tuskaloosa of the regional Mississippian culture. In 1540 he arranged an ambush of soldiers of Hernando de Soto's expedition in an effort to expel them from the territory. The Spaniards were armed with guns and killed many of the tribe. Mobile County and Washington County, Alabama make up the Mobile Metropolitan Statistical Area with a 2020 population of 430,197. The Mobile, AL MSA and Daphne-Fairhope-Foley, AL MSA make up the much larger Mobile-Daphne-Fairhope CSA with a 2020 population of 661,964.
The northern border of Mobile County and southern area of neighboring Washington County constitute the homeland of the state-recognized tribe of
History
This area was occupied for thousands of years by varying cultures of
The historic Choctaw emerged somewhat later, and are believed to be descendants of those earlier peoples. They occupied this area along what early French traders and colonists called the Mobile River. They also founded the settlement of Mobile on the river and bay in the early eighteenth century.
The British took over the territory in 1763 (along with other French territories east of the Mississippi River) after defeating the French in the Seven Years' War. During the American Revolutionary War, it came under Spanish rule as part of Spanish Florida. Spain ceded the territory to the United States after the War of 1812.
In the 1830s, the United States forced the removal of most of the Native American tribes in the area under President Andrew Jackson's policy and an act of Congress to relocate them to Indian Territory west of the Mississippi River. Many of those who remained continued their culture, and took refuge in the swamps in the border area between Mobile and Washington counties. Since the late 20th century, several tribes have reorganized and gained state recognition. Among those is the MOWA Band of Choctaw Indians, which was recognized as a tribe in 1979 by the state. The people have long been based in this area of the former Choctaw homeland, along the northern border of Mobile County and the southern border of Washington County.
After more than a century of European settlement, beginning with French colonists, Mobile County was organized by the state legislature and the proclamation of Governor Holmes of the Mississippi Territory on December 18, 1812.[1] When Mississippi was separated and admitted as a state on December 10, 1817, after adopting its constitution on August 15, 1817, Mobile County became part of what was called the Alabama Territory. Two years later, the county became part of the state of Alabama, granted statehood on December 14, 1819.[4][5]
The city of Mobile, first settled by French colonists in the early 18th century as part of
At the end of the War of 1812, the United States took over the territory. At that time, new settlers were being attracted to the land, eager to develop short-staple cotton in the uplands area. Invention of the cotton gin made processing of this type of cotton profitable, stimulating wholesale development of new cotton plantations in the Black Belt during the antebellum years. Mobile developed as a major deepwater port; in the nineteenth century, cotton was its major export.
There were nine documented lynchings in Mobile from 1891 to 1981.
- March 31, 1891 — Zachariah Graham[6]
- October 2, 1906 — Roy Hoyle[7]
- October 2, 1906 — Willie Thompson[8]
- October 2, 1906 — Corneilius Robinson[9]
- September 22, 1907 — Mose Dossett[10]
- January 23, 1909 — Richard Robertson[11]
- July 31, 1910 — Bill Walker[12]
- June 6, 1919 — James E. Lewis[13]
- March 21, 1981 — Michael Donald
Courthouse fires occurred in the years 1823, 1840, and 1872.[1]
Geography

According to the
Major highways
 Interstate 10
 Interstate 65
 Interstate 165
 planned western bypass
- U.S. Highway 43
- U.S. Highway 45
- U.S. Highway 90
- U.S. Highway 98
 State Route 158
 State Route 163
 State Route 188
 State Route 193
 State Route 213
 State Route 217
Transit
Adjacent counties
- Washington County (north)
- Baldwin County (east)
- Jackson County, Mississippi (southwest)
- George County, Mississippi (west)
- Greene County, Mississippi (northwest)
National protected areas
Demographics
| Census | Pop. | Note | %± |
|---|---|---|---|
| 1820 | 2,672 | — | |
| 1830 | 6,267 | 134.5% | |
| 1840 | 18,741 | 199.0% | |
| 1850 | 27,600 | 47.3% | |
| 1860 | 41,131 | 49.0% | |
| 1870 | 49,311 | 19.9% | |
| 1880 | 48,653 | −1.3% | |
| 1890 | 51,587 | 6.0% | |
| 1900 | 62,740 | 21.6% | |
| 1910 | 80,854 | 28.9% | |
| 1920 | 100,117 | 23.8% | |
| 1930 | 118,363 | 18.2% | |
| 1940 | 141,974 | 19.9% | |
| 1950 | 231,105 | 62.8% | |
| 1960 | 314,301 | 36.0% | |
| 1970 | 317,308 | 1.0% | |
| 1980 | 364,980 | 15.0% | |
| 1990 | 378,643 | 3.7% | |
| 2000 | 399,843 | 5.6% | |
| 2010 | 412,992 | 3.3% | |
| 2020 | 414,809 | 0.4% | |
| 2023 (est.) | 411,640 | [15] | −0.8% |
| U.S. Decennial Census[16] 1790–1960[17] 1900–1990[18] 1990–2000[19] 2010–2020[2] | |||
2020 census
| Race / Ethnicity | Pop 2000[20] | Pop 2010[21] | Pop 2020[22] | % 2000 | % 2010 | % 2020 |
|---|---|---|---|---|---|---|
White alone (NH)
|
249,763 | 243,904 | 226,703 | 62.47% | 59.06% | 54.65% |
Black or African American alone (NH)
|
132,845 | 142,272 | 145,435 | 33.22% | 34.45% | 35.06% |
Alaska Native alone (NH)
|
2,636 | 3,541 | 3,743 | 0.66% | 0.86% | 0.90% |
| Asian alone (NH) | 5,599 | 7,507 | 8,515 | 1.40% | 1.82% | 2.05% |
| Pacific Islander alone (NH) | 79 | 157 | 216 | 0.02% | 0.04% | 0.05% |
| Some Other Race alone (NH) | 319 | 428 | 1,302 | 0.08% | 0.10% | 0.31% |
| Mixed Race/Multi-Racial (NH) | 3,715 | 5,247 | 15,470 | 0.93% | 1.27% | 3.73% |
| Hispanic or Latino (any race) | 4,887 | 9,936 | 13,425 | 1.22% | 2.41% | 3.24% |
| Total | 399,843 | 412,992 | 414,809 | 100.00% | 100.00% | 100.00% |
As of the 2020 census, there were 414,809 people, 163,750 households, and 107,701 families residing in the county.[23] The population density was 337.4 inhabitants per square mile (130.3/km2) There were 184,441 housing units.
The county's largest city, Mobile (population 187,041 per the 2020 census) is majority minority with African-Americans making up 51.06% of its population.[24]
2010 census
According to the 2010 census, the population of the county comprised the following racial and ethnic groups:
- 60.2% White
- 34.6% Black
- 0.9% Native American
- 1.8% Asian
- 0.0% Pacific Islander
- 1.5% Two or more races
- 2.4% Hispanic or Latino (of any race)
2000 census
As of the
There were 150,179 households, out of which 34.40% had children under the age of 18 living with them, 49.50% were married couples living together, 17.70% had a female householder with no husband present, and 28.90% were non-families. 24.80% of all households were made up of individuals, and 8.80% had someone living alone who was 65 years of age or older. The average household size was 2.61 and the average family size was 3.13.
In the county, the population dispersal was 27.50% under the age of 18, 10.00% from 18 to 24, 28.70% from 25 to 44, 21.90% from 45 to 64, and 12.00% who were 65 years of age or older. The median age was 34 years. For every 100 females, there were 91.50 males. For every 100 females age 18 and over, there were 87.10 males. The median income for a household in the county was $33,710, and the median income for a family was $40,378. Males had a median income of $32,329 versus $21,986 for females. The
Government

Local
Mobile County has a limited form of home rule and is governed by a three-member county commission. Each commissioner represents a single-member district and is elected by the voters of that district to serve a four-year term. Each commissioner has an equal vote on the commission. During an elected term, each commissioner serves as President of the Mobile County Commission for 16 months, beginning with the District 1 Commissioner.
As of November 2020, Mobile County Commissioners are:
- District 1 (northern County) – Merceria L. Ludgood (D)
- District 2 (western and central County) – Connie Hudson (R)
- District 3 (southern County) – Randall Dueitt (R)
State
Under the state constitution, the legislature maintains considerable power over county affairs. Mobile County is represented in the
Education
In most areas of Mobile County, schools are operated by the
Mobile County is the home of the University of South Alabama (USA), a public research university divided into ten colleges, including one of Alabama's two state-supported medical schools. USA has an enrollment of over 16,000 students and employs more than 6,000 faculty, administrators, and support staff. It is also home to two private institutions of higher learning. Spring Hill College, founded in 1830, is Catholic and the third-oldest Jesuit college or university in the U.S. Its enrollment is about 1,500 students and it offers 46 academic majors. University of Mobile, established in 1961 and affiliated with Alabama Baptist Convention, has an enrollment of about 2,000 and offers 90 academic majors.
Politics
During the late 20th century,
Today the population of Mobile County is majority white; at the time of the Civil War, it was majority black. In 2004, the incumbent Republican president
In the 2008 presidential election, Mobile County cast the majority of its votes for the Republican candidate John McCain. He won 54% of the vote and 98,049 votes. Democrat Barack Obama received 45% of the vote and 82,181 votes. Other candidates won 1% of the vote.[28]
In the Senate off-year election in 2008, Republican
Within the city of Mobile, the margins between the Republican and Democrat candidates are usually between 10 and 19 points. Since 1996, the Democrats have gotten 40-45% of the vote.
| Year | Republican | Democratic | Third party | |||
|---|---|---|---|---|---|---|
| No. | % | No. | % | No. | % | |
| 2020 | 101,243 | 55.27% | 79,474 | 43.39% | 2,447 | 1.34% |
| 2016 | 95,116 | 55.06% | 72,186 | 41.79% | 5,435 | 3.15% |
| 2012 | 94,893 | 54.18% | 78,760 | 44.97% | 1,487 | 0.85% |
| 2008 | 98,049 | 54.04% | 82,181 | 45.30% | 1,194 | 0.66% |
| 2004 | 92,014 | 58.69% | 63,732 | 40.65% | 1,025 | 0.65% |
| 2000 | 78,162 | 55.93% | 58,640 | 41.96% | 2,943 | 2.11% |
| 1996 | 66,775 | 51.32% | 54,749 | 42.08% | 8,579 | 6.59% |
| 1992 | 72,935 | 50.72% | 54,962 | 38.22% | 15,891 | 11.05% |
| 1988 | 72,203 | 60.88% | 45,524 | 38.39% | 870 | 0.73% |
| 1984 | 81,923 | 62.56% | 47,252 | 36.08% | 1,784 | 1.36% |
| 1980 | 67,515 | 57.71% | 46,180 | 39.47% | 3,297 | 2.82% |
| 1976 | 53,835 | 50.85% | 50,264 | 47.47% | 1,777 | 1.68% |
| 1972 | 62,639 | 73.15% | 20,694 | 24.17% | 2,301 | 2.69% |
| 1968 | 10,509 | 11.43% | 18,615 | 20.25% | 62,812 | 68.32% |
| 1964 | 49,493 | 70.72% | 0 | 0.00% | 20,488 | 29.28% |
| 1960 | 24,608 | 45.12% | 28,626 | 52.48% | 1,308 | 2.40% |
| 1956 | 20,639 | 52.21% | 17,163 | 43.41% | 1,732 | 4.38% |
| 1952 | 14,153 | 49.29% | 14,473 | 50.40% | 89 | 0.31% |
| 1948 | 2,685 | 19.41% | 0 | 0.00% | 11,150 | 80.59% |
| 1944 | 2,867 | 23.08% | 9,439 | 75.98% | 117 | 0.94% |
| 1940 | 1,887 | 13.99% | 11,480 | 85.08% | 126 | 0.93% |
| 1936 | 1,072 | 8.64% | 11,165 | 89.95% | 175 | 1.41% |
| 1932 | 1,705 | 14.90% | 9,658 | 84.42% | 78 | 0.68% |
| 1928 | 5,058 | 45.84% | 5,965 | 54.07% | 10 | 0.09% |
| 1924 | 1,814 | 28.54% | 4,125 | 64.91% | 416 | 6.55% |
| 1920 | 2,681 | 29.71% | 6,171 | 68.39% | 171 | 1.90% |
| 1916 | 832 | 21.36% | 2,968 | 76.18% | 96 | 2.46% |
| 1912 | 140 | 3.72% | 3,009 | 79.98% | 613 | 16.29% |
| 1908 | 453 | 14.03% | 2,422 | 75.03% | 353 | 10.94% |
| 1904 | 325 | 8.84% | 3,283 | 89.33% | 67 | 1.82% |
| 1900 | 2,243 | 41.64% | 2,939 | 54.56% | 205 | 3.81% |
| 1896 | 2,778 | 37.76% | 3,948 | 53.66% | 631 | 8.58% |
| 1892 | 397 | 5.63% | 4,680 | 66.33% | 1,979 | 28.05% |
| 1888 | 2,542 | 44.98% | 3,109 | 55.02% | 0 | 0.00% |
Communities
Cities
- Bayou La Batre
- Chickasaw
- Citronelle
- Creola
- Mobile (county seat)
- Prichard
- Saraland
- Satsuma
- Semmes
Towns
Census-designated places
Unincorporated communities
Ghost town
See also
- National Register of Historic Places listings in Mobile, Alabama
- National Register of Historic Places listings in Mobile County, Alabama
- Properties on the Alabama Register of Landmarks and Heritage in Mobile County, Alabama
References
- ^ a b c d e "Mobile County, Alabama history". Alabama Department of Archives and History (ADAH). June 5, 2009. Archived from the original on February 3, 2013. Retrieved June 14, 2009.
- ^ a b "State & County QuickFacts". United States Census Bureau. Retrieved March 14, 2024.
- ^ "Find a County". National Association of Counties. Retrieved June 7, 2011.
- ^ "An 1820 Claim to Congress: Alabama Territory : 1817". The Intruders. TNGenNet Inc. 2001.
- ^ "Statehood Dates". 50states.com. 2009 [1998].
- ^ "CSDE Lynching Database". lynching.csde.washington.edu. Retrieved September 24, 2017.
- ^ "CSDE Lynching Database". lynching.csde.washington.edu. Retrieved September 24, 2017.
- ^ "CSDE Lynching Database". lynching.csde.washington.edu. Retrieved September 24, 2017.
- ^ "CSDE Lynching Database". lynching.csde.washington.edu. Retrieved September 24, 2017.
- ^ "CSDE Lynching Database". lynching.csde.washington.edu. Retrieved September 24, 2017.
- ^ "CSDE Lynching Database". lynching.csde.washington.edu. Retrieved September 24, 2017.
- ^ "CSDE Lynching Database". lynching.csde.washington.edu. Retrieved September 24, 2017.
- ^ "CSDE Lynching Database". lynching.csde.washington.edu. Retrieved September 24, 2017.
- ^ "2010 Census Gazetteer Files". United States Census Bureau. August 22, 2012. Retrieved August 22, 2015.
- ^ "Annual Estimates of the Resident Population for Counties: April 1, 2020 to July 1, 2023". Retrieved March 14, 2024.
- ^ "U.S. Decennial Census". United States Census Bureau. Retrieved August 22, 2015.
- ^ "Historical Census Browser". University of Virginia Library. Retrieved August 22, 2015.
- ^ Forstall, Richard L., ed. (March 24, 1995). "Population of Counties by Decennial Census: 1900 to 1990". United States Census Bureau. Retrieved August 22, 2015.
- ^ "Census 2000 PHC-T-4. Ranking Tables for Counties: 1990 and 2000" (PDF). United States Census Bureau. April 2, 2001. Retrieved August 22, 2015.
- ^ "P004 HISPANIC OR LATINO, AND NOT HISPANIC OR LATINO BY RACE – 2000: DEC Summary File 1 – Mobile County, Alabama". United States Census Bureau.
- ^ "P2 HISPANIC OR LATINO, AND NOT HISPANIC OR LATINO BY RACE – 2010: DEC Redistricting Data (PL 94-171) – Mobile County, Alabama". United States Census Bureau.
- ^ "P2 HISPANIC OR LATINO, AND NOT HISPANIC OR LATINO BY RACE - 2020: DEC Redistricting Data (PL 94-171) – Mobile County, Alabama". United States Census Bureau.
- ^ "US Census Bureau, Table P16: Household Type". United States Census Bureau. Retrieved March 14, 2024.
- ^ "P2 HISPANIC OR LATINO, AND NOT HISPANIC OR LATINO BY RACE - 2020: DEC Redistricting Data (PL 94-171) - Mobile city, Alabama". United States Census Bureau.
- ^ "Roster of the Alabama State Senate". Official Website of the Alabama Legislature. Archived from the original on June 29, 2013. Retrieved July 5, 2013.
- ^ "Roster of the Alabama House of Representatives". Official Website Of The Alabama Legislature. Archived from the original on June 21, 2013. Retrieved July 5, 2013.
- ^ "2020 CENSUS - SCHOOL DISTRICT REFERENCE MAP: Mobile County, AL" (PDF). United States Census Bureau. Retrieved July 31, 2022. - Text list
- ^ a b c David Leip (2008). "Atlas of United States Presidential Election Results".
- ^ Leip, David. "Dave Leip's Atlas of U.S. Presidential Elections". uselectionatlas.org. Retrieved June 24, 2018.
External links
- Mobile County, Alabama, official website
- Map of roads/towns in Mobile County from University of Alabama
- South Alabama Community Website
Places adjacent to Mobile County, Alabama | |
|---|---|
Municipalities and communities of Mobile County, Alabama, United States | ||
|---|---|---|
| Cities | 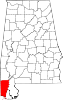 | |
| Towns | ||
| CDPs | ||
| Unincorporated communities | ||
| Ghost town | ||
| Indian reservation | ||
| Footnotes | ‡This populated place also has portions in an adjacent county or counties | |
| ||
Montgomery (capital) | |
| Topics | |
| Society |
|
| Regions | |
| Flora and fauna | |
Largest cities | |
| Metros |
|
| Counties |
|
| International | |
|---|---|
| National | |
| Geographic | |
| Other | |