
South Holland
South Holland
Zuid-Holland (Dutch) | |
|---|---|
|
States of South Holland | |
| Area (2023)[1] | |
| • Total | 3,308 km2 (1,277 sq mi) |
| • Land | 2,698 km2 (1,042 sq mi) |
| • Water | 609 km2 (235 sq mi) |
| • Rank | 6th |
| Population (1 January 2023)[2] | |
| • Total | 3,804,906 |
| • Rank | 1st |
| • Density | 1,410/km2 (3,700/sq mi) |
| • Rank | 1st |
| GDP | |
| • Total | €200.451 billion (2022) |
| • Per capita | €53,600 (2022) |
| ISO 3166 code | NL-ZH |
| HDI (2019) | 0.943[4] very high · 4th of 12 |
| Website | zuid-holland.nl |
South Holland (
History
Early history
Archaeological discoveries in
After the departure of the Romans, the area belonged to the


The first city in South Holland to receive city rights was
Overall, the area of South Holland remained largely agrarian throughout the late Middle Ages. This changed around 1500, when Holland became Europe's most urbanised area. During the Eighty Years' War, the area of South Holland was the scene of the Capture of Brielle, the Siege of Leiden and the assassination of William the Silent.
The
As a province
The province of South Holland as it is today has its origins in the period of French rule from 1795 to 1813. This was a time of bewildering changes to the Dutch system of provinces. In 1795, the Batavian Republic was proclaimed and the old order was swept away by a series of constitutional changes in the following years. In the Constitution enacted on 23 April 1798, the old borders were radically changed. The republic was reorganised into eight departments with roughly equal populations. The south of Holland was split up into three departments. The islands in the south were merged with Zeeland and the west of North Brabant to form the Department of the Scheldt and Meuse. The north of the area became the Department of the Delf. A small region in the east of the area became part of the Department of the Rhine, which spanned much of Gelderland and Utrecht. In 1801, the old borders were restored when the department of Holland was created. The reorganisation had been short-lived, but it gave birth to the concept of a division of Holland, creating less dominant provinces. In 1807, Holland was reorganised once again. This time, the department was split in two. The south, what would later become South Holland, was called the Department of Maasland. This also did not last long. In 1810, all the Dutch provinces were integrated into the French Empire, and Maasland was renamed Bouches-de-la-Meuse.
After the defeat of the French in 1813, this organisation remained unchanged for a year or so. When the 1814 Constitution was introduced, most borders were restored to their situation before the
The construction of the
Geography
South Holland covers an area of 3,308 km2 (1,277 sq mi), of which 609 km2 (235 sq mi) is water. It borders the North Sea to the west, North Holland to the north, Utrecht and Gelderland to the east, and North Brabant and Zeeland to the south. Beside the dunes along the North Sea coast, the province is almost entirely flat and mostly consists of polders. The centre of South Holland and the area along the coast in the west are largely urban, part of the Randstad conurbation, while the east of the province is more agrarian and belongs to the Groene Hart, literally Green Heart. The south of the province is a collection of islands in the Rhine–Meuse–Scheldt delta. For census reasons, South Holland is divided into five regions: Rijnmond, South, West, East, and Southwest.
The
The southern part of South Holland consists of a number of islands of the Rhine–Meuse–Scheldt delta. Although technically islands in the sense that they are surrounded by rivers, canals or other bodies of water, most of these islands are well connected to the rest of the province via bridges, tunnels and dams. The southern islands, most notably Goeree-Overflakkee (1 on the map), Tiengemeten (2), Hoeksche Waard (6) and Voorne-Putten (4/5), are largely agrarian, while more to the north, the islands are more urban, such as Dordrecht (7), IJsselmonde (9) and Rozenburg (10), while other islands, like Rozenburg (10), are mostly used for petrochemical industry. Together, these cities form the Rijnmond conurbation, centred on the city of Rotterdam. Together with Haaglanden (centred on The Hague) and Delfland (centred on Delft) in the north, and the Drechtsteden to the south-east, this conurbation in turn forms the South Wing of the Randstad conurbation, which spans across South Holland, North Holland and Utrecht.
Other regions in South Holland include Alblasserwaard, Gouwestreek ("The Gouwe Area"), Hoeksche Waard, Krimpenerwaard, Rijnland ("Rhineland"), Rijnstreek ("The Rhine Area"), Vijfheerenlanden and Westland (roughly including Hook of Holland and the municipalities of Westland and Midden-Delfland).
-
 A satellite image of the Rhine–Meuse–Scheldt delta, showing the islands of South Holland
 -
 A satellite image of South Holland
 -
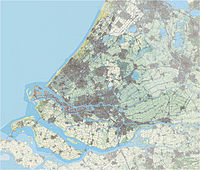 A topographic map of South Holland as of 2013


Climate
Like the rest of the Netherlands, South Holland experiences a temperate oceanic climate, a Cfb-class according to the Köppen climate classification. The climate is influenced by the North Sea and the Atlantic Ocean, which results in relatively cooler summers and milder winters. Rain showers are common in the fall and winter seasons. Because of the flat surface, wind storms are also not uncommon in the winter. Although rain occurs all year long, the first six months of the year are relatively dry. Eastern winds can result in temporary continental climate conditions with relatively warm and dry summers and cold and stormy winters. The temperature varies between the 2 °C and 6 °C in the winter and 17 °C and 20 °C in the summer.
| Climate data for Rotterdam The Hague Airport | |||||||||||||
|---|---|---|---|---|---|---|---|---|---|---|---|---|---|
| Month | Jan | Feb | Mar | Apr | May | Jun | Jul | Aug | Sep | Oct | Nov | Dec | Year |
| Record high °C (°F) | 14.1 (57.4) |
16.7 (62.1) |
21.2 (70.2) |
26.7 (80.1) |
30.5 (86.9) |
32.8 (91.0) |
33.1 (91.6) |
34.9 (94.8) |
29.0 (84.2) |
24.8 (76.6) |
18.3 (64.9) |
15.1 (59.2) |
34.9 (94.8) |
| Mean daily maximum °C (°F) | 6.0 (42.8) |
6.6 (43.9) |
9.9 (49.8) |
13.5 (56.3) |
17.5 (63.5) |
19.9 (67.8) |
22.2 (72.0) |
22.1 (71.8) |
18.9 (66.0) |
14.7 (58.5) |
9.9 (49.8) |
6.6 (43.9) |
14.0 (57.2) |
| Daily mean °C (°F) | 3.6 (38.5) |
3.7 (38.7) |
6.4 (43.5) |
9.1 (48.4) |
12.9 (55.2) |
15.5 (59.9) |
17.8 (64.0) |
17.6 (63.7) |
14.8 (58.6) |
11.2 (52.2) |
7.3 (45.1) |
4.2 (39.6) |
10.4 (50.7) |
| Mean daily minimum °C (°F) | 0.8 (33.4) |
0.5 (32.9) |
2.6 (36.7) |
4.3 (39.7) |
7.8 (46.0) |
10.6 (51.1) |
13.1 (55.6) |
12.8 (55.0) |
10.6 (51.1) |
7.5 (45.5) |
4.2 (39.6) |
1.4 (34.5) |
6.4 (43.5) |
| Record low °C (°F) | −17.1 (1.2) |
−13.8 (7.2) |
−11.4 (11.5) |
−6.0 (21.2) |
−1.4 (29.5) |
0.5 (32.9) |
3.6 (38.5) |
4.6 (40.3) |
0.4 (32.7) |
−5.1 (22.8) |
−7.5 (18.5) |
−13.3 (8.1) |
−17.1 (1.2) |
| Average precipitation mm (inches) | 69.4 (2.73) |
57.9 (2.28) |
64.9 (2.56) |
42.6 (1.68) |
58.3 (2.30) |
65.2 (2.57) |
74.0 (2.91) |
81.0 (3.19) |
87.1 (3.43) |
90.1 (3.55) |
87.1 (3.43) |
78.3 (3.08) |
855.6 (33.69) |
| Average precipitation days (≥ 1 mm) | 12 | 10 | 12 | 9 | 9 | 10 | 10 | 10 | 12 | 12 | 13 | 13 | 131 |
| Average snowy days | 6 | 5 | 4 | 2 | 0 | 0 | 0 | 0 | 0 | 0 | 2 | 4 | 22 |
| Average relative humidity (%)
|
88 | 85 | 83 | 78 | 77 | 79 | 79 | 80 | 84 | 86 | 89 | 89 | 83 |
| Mean monthly sunshine hours | 62.5 | 83.8 | 124.0 | 174.9 | 213.9 | 203.6 | 213.1 | 196.6 | 137.6 | 106.9 | 60.4 | 46.7 | 1,623.8 |
| Source 1: Royal Netherlands Meteorological Institute (1981–2010 normals, snowy days normals for 1971–2000)[8] | |||||||||||||
| Source 2: Royal Netherlands Meteorological Institute (1971–2000 extremes)[9] | |||||||||||||
Municipalities
South Holland is divided into 50
- Leiden & Bollenstreek COROP group
- The Hague COROP group
- Delft & Westland COROP group
- East South Holland COROP group
- Rijnmond COROP group
- South East South Holland COROP group
Economy
The Gross domestic product (GDP) of the region was 163.8 billion € in 2018. This contributes to the gross domestic product of the Netherlands by 21.2%. GDP per capita adjusted for purchasing power was 38,700 € or 128% of the EU27 average in the same year.[10] South Holland's labour force amounts to 1,661,000 people; 47.1% of the total population. The unemployment rate is 6.1% in 2013.[11]
The main sectors of economical activity in this province are among others:
- Horticulture is an important sector in South Holland. The province is home to around 2550 glasshouse companies, approximately half of the Netherlands' total.[12] Specifically the Westland is well known for its intensive horticulture. The glasshouses in this region cover an area of 2,750 hectares (10.6 sq mi),[13] making it the world's largest contiguous greenhouse area.[14]
- Flower bulb cultivation;
- Port of Rotterdam;
- Petrochemical industry, particularly near Rotterdam neighbourhood Pernis; (Shell's refinery there is the largest oil refinery in Europe, and one of the largest in the world);
- The service-oriented economy of The Hague, where many jobs are offered by the national government (of which the main administrative parts are settled in this town), international institutions and headquarters of several large international businesses;
- Tourism-related activities (among others in historic places like Delft, and several seaside resorts);
- Commercial fishing; main South Holland fishing places are Katwijk and Scheveningen;
- Stockbreeding, of which in this province dairy industry is the main sector.
-
 Waalhaven in the Port of Rotterdam
 -
 Flower fields near Lisse
 -
Drone footage of flower fields near De Zilk

.jpg)
Religion
This section needs expansion. You can help by adding to it. (July 2021) |
Religion in South Holland (2015)[15]
In 2015, 18.2% of the population belonged to the
Notable residents
Among the well-known scientists originating from South Holland are:
- Christiaan Huygens (1629–1695), mathematician, physicist, astronomer and inventor
- Antonie van Leeuwenhoek (1632–1723), father of microbiology and developer of the microscope
- Desiderius Erasmus, philosopher and humanist.
As far as art examined, several famous painters originate from this province; such as:
- Rembrandt, (Leiden)
- Jan Steen, (Leiden)
- Johannes Vermeer, (Delft)
See also
- List of cities, towns and villages in South Holland
- Politics of South Holland
- Zijl
References
- ^ Statistieken provincie Zuid-Holland - Gegevens over meer dan 100 onderwerpen!, AlleCijfers.nl
- ^ a b "CBS StatLine".
- ^ "Regional key figures; National Accounts". www.cbs.nl. 22 December 2023.
- ^ "Sub-national HDI - Area Database". Global Data Lab. Retrieved 13 September 2018.
- ^ "Category:Delftse Hout". Wikimedia Commons.
- ^ "Ackerdijkse plassen web page in Dutch". Archived from the original on 19 October 2013. Retrieved 4 December 2013.
- ^ "Page in Dutch about Westerpark on site Zoetermeer municipality". Archived from the original on 12 December 2013.
- ^ "Klimaattabel Rotterdam, langjarige gemiddelden, tijdvak 1981–2010" (PDF) (in Dutch). Royal Netherlands Meteorological Institute. Retrieved 10 September 2013.
- ^ "Klimaattabel Rotterdam, langjarige extremen, tijdvak 1971–2000" (PDF) (in Dutch). Royal Netherlands Meteorological Institute. Retrieved 10 September 2013.[permanent dead link]
- ^ "Regional GDP per capita ranged from 30% to 263% of the EU average in 2018". Eurostat.
- ^ "Regio's in economisch perspectief 2013" (PDF) (in Dutch). 30 November 2012. Archived from the original (PDF) on 16 April 2014. Retrieved 15 April 2014.
- ^ "Leegstand van kassen in Westland dreigt" (in Dutch). Nu.nl. 22 October 2012. Retrieved 29 April 2014.
- ^ "De Kracht van het Westland" (PDF) (in Dutch). 2008. Archived from the original (PDF) on 29 April 2014. Retrieved 29 April 2014.
- ^ "GLASTUINBOUW" (in Dutch). Westland.nl. 22 October 2012. Retrieved 29 April 2014.
- ^ Helft Nederlanders is kerkelijk of religieus, CBS, 22 December 2016
External links
- Province of South Holland website (in Dutch)
- English home page on Province of South Holland website (limited info in English)
- Deltaworks Online Website on flood protection in South Holland river delta

| ||
 | ||
| International | |
|---|---|
| National | |
| Geographic | |